
Donald TrumpRepublicans · 1,782 related reports
Ongoing coverage of the Nov. 3 US elections: state-by-state Senate, governor and House races, polls, candidates, campaign money and what both parties are saying, updated daily.
 How midterm losses and the Nvidia scandal could affect Trump’s Asia visit
 Three Democratic governors discuss 2028 and post-midterm strategy
 What’s Next for the Republican Party, and How Democrats Should Use Their Power in Congress
 White House fires back at Democrat’s warning, vows ‘vigorous response’
 Post Game: Can JD Vance clear the field in the 2028 primary?
 Record number of women elected to US Congress and governorships in midterms
 ABC News
 Bloomberg News
 ReutersReuters
 TASS
 CNN
 The Associated Press
Seats up this year and the party that holds each now. Pick a state for its candidates, polls and results.
Seat held by a RepublicanSeat held by a DemocratNot up this year
Mostly Republican seatsMostly Democratic seatsEvenly split
Republican governorDemocratic governorNo governor race this year
Now held by Dan Sullivan
Counting continues; the result may still change. Fetched 2026-11-16 02:13 UTC. civicAPI
Vote counts come from civicAPI, which gathers the counts published by state election offices; we transcribe them and do not tally.
The latest three surveys as each pollster published them; we show them as released and do not calculate, weight or average them. Percentages are the share of respondents who say they would vote for each candidate. Surveys differ in timing, sample and method, so their numbers are not directly comparable.
| Pollster | Dates | Sample · population | Share who would vote for the candidate |
|---|---|---|---|
| The New York Times/Siena University2026-10-23 – 2026-10-30 610 · likely voters | 2026-10-23 – 2026-10-30 | 610 · likely voters | Mary Peltola 48% Daniel J. Sullivan Jr. 46% |
| Data for Progress2026-10-08 – 2026-10-16 671 · likely voters | 2026-10-08 – 2026-10-16 | 671 · likely voters | Mary Peltola 51% Daniel J. Sullivan Jr. 49% |
| Public Policy Pollingpartisan poll (DEM)2026-10-14 – 2026-10-15 578 · registered voters | 2026-10-14 – 2026-10-15 | 578 · registered voters | Mary Peltola 48% Daniel J. Sullivan Jr. 47% |
Now held by Mike Dunleavy
Counting continues; the result may still change. Fetched 2026-11-16 02:13 UTC. civicAPI
Vote counts come from civicAPI, which gathers the counts published by state election offices; we transcribe them and do not tally.
The latest three surveys as each pollster published them; we show them as released and do not calculate, weight or average them. Percentages are the share of respondents who say they would vote for each candidate. Surveys differ in timing, sample and method, so their numbers are not directly comparable.
| Pollster | Dates | Sample · population | Share who would vote for the candidate |
|---|---|---|---|
| The New York Times/Siena University2026-10-23 – 2026-10-30 610 · likely voters | 2026-10-23 – 2026-10-30 | 610 · likely voters | Jonathan Kreiss-Tomkins 54% Bernadette Wilson 46% |
| Alaska Survey Research2026-10-23 – 2026-10-25 1,068 · likely voters | 2026-10-23 – 2026-10-25 | 1,068 · likely voters | Jonathan Kreiss-Tomkins 53.4% Bernadette Wilson 46.6% |
| Alaska Survey Research2026-10-15 – 2026-10-18 1,568 · likely voters | 2026-10-15 – 2026-10-18 | 1,568 · likely voters | Jonathan Kreiss-Tomkins 55% Bernadette Wilson 45% |
The state has 1 seats in the US House; its current members are 1 Republican. Every seat is up for election on November 3.
Counting continues; the result may still change. Fetched 2026-11-16 02:13 UTC. civicAPI
| District | Candidates and votes |
|---|---|
| At-large | Nick Begich III (Republican, leading) · 133,707 votes 47.8% Bill Hill (Nonpartisan) · 116,932 votes 41.8% Eric Hafner (Democratic) · 21,815 votes 7.8% James C. "Jim" McDermott (Libertarian) · 7,384 votes 2.6% |
Vote counts come from civicAPI, which gathers the counts published by state election offices; we transcribe them and do not tally.
 NBC NewsNBC NewsThe Associated PressThe Associated Press
Now held by Tommy Tuberville
Counting continues; the result may still change. Fetched 2026-11-16 02:13 UTC. civicAPI
Vote counts come from civicAPI, which gathers the counts published by state election offices; we transcribe them and do not tally.
The latest three surveys as each pollster published them; we show them as released and do not calculate, weight or average them. Percentages are the share of respondents who say they would vote for each candidate. Surveys differ in timing, sample and method, so their numbers are not directly comparable.
| Pollster | Dates | Sample · population | Share who would vote for the candidate |
|---|---|---|---|
| Blueprint Polling2026-10-22 – 2026-10-24 695 · likely voters | 2026-10-22 – 2026-10-24 | 695 · likely voters | Barry Moore 48% Everett Wess 40% |
| Cygnalfor Gray Television, Alabama Daily News2026-10-16 – 2026-10-17 500 · likely voters | 2026-10-16 – 2026-10-17 | 500 · likely voters | Barry Moore 50% Everett Wess 35% |
| The Alabama Poll2026-10-15 – 2026-10-16 600 · likely voters | 2026-10-15 – 2026-10-16 | 600 · likely voters | Barry Moore 56% Everett Wess 35% |
Now held by Kay Ivey
Counting continues; the result may still change. Fetched 2026-11-16 02:13 UTC. civicAPI
Vote counts come from civicAPI, which gathers the counts published by state election offices; we transcribe them and do not tally.
The latest three surveys as each pollster published them; we show them as released and do not calculate, weight or average them. Percentages are the share of respondents who say they would vote for each candidate. Surveys differ in timing, sample and method, so their numbers are not directly comparable.
| Pollster | Dates | Sample · population | Share who would vote for the candidate |
|---|---|---|---|
| Blueprint Polling2026-10-22 – 2026-10-24 695 · likely voters | 2026-10-22 – 2026-10-24 | 695 · likely voters | Tommy Tuberville 48% Doug Jones 45% |
| The Alabama Poll2026-10-15 – 2026-10-16 600 · likely voters | 2026-10-15 – 2026-10-16 | 600 · likely voters | Tommy Tuberville 51% Doug Jones 39% |
| RMG Researchpartisan poll (REP) · for Alabama Policy Action2026-09-21 – 2026-09-25 800 · registered voters | 2026-09-21 – 2026-09-25 | 800 · registered voters | Tommy Tuberville 50% Doug Jones 37% |
The state has 7 seats in the US House; its current members are 5 Republicans and 2 Democrats. Every seat is up for election on November 3.
Counting continues; the result may still change. Fetched 2026-11-16 02:13 UTC. civicAPI
| District | Candidates and votes |
|---|---|
| District 1 | Jerry Carl (Republican, leading) · 137,025 votes 59.1% Clyde Jones (Democratic) · 94,940 votes 40.9% |
| District 2 | Shomari Figures (Democratic, leading) · 124,422 votes 53.8% Rhett Marques (Republican) · 107,049 votes 46.2% |
| District 3 | Mike Rogers (Republican, leading) · 141,800 votes 64.0% Lee McInnis (Democratic) · 79,926 votes 36.0% |
| District 4 | Robert Aderholt (Republican, leading) · 160,008 votes 74.9% Amanda Pusczek (Democratic) · 53,633 votes 25.1% |
| District 5 | Dale Strong (Republican, leading) · 142,080 votes 53.2% Andrew Sneed (Democratic) · 124,763 votes 46.8% |
| District 6 | Gary Palmer (Republican, leading) · 149,921 votes 57.5% Maurice Mercer (Democratic) · 110,957 votes 42.5% |
| District 7 | Terri Sewell (Democratic, leading) · 174,823 votes 69.4% Ammie Akin (Republican) · 77,085 votes 30.6% |
Vote counts come from civicAPI, which gathers the counts published by state election offices; we transcribe them and do not tally.
No related reports for this state yet.
Now held by Tom Cotton
Counting continues; the result may still change. Fetched 2026-11-16 02:13 UTC. civicAPI
Vote counts come from civicAPI, which gathers the counts published by state election offices; we transcribe them and do not tally.
The latest three surveys as each pollster published them; we show them as released and do not calculate, weight or average them. Percentages are the share of respondents who say they would vote for each candidate. Surveys differ in timing, sample and method, so their numbers are not directly comparable.
| Pollster | Dates | Sample · population | Share who would vote for the candidate |
|---|---|---|---|
| GrayHousepartisan poll (REP) · for America One Policies2026-10-27 – 2026-10-28 509 · likely voters | 2026-10-27 – 2026-10-28 | 509 · likely voters | Tom Cotton 55% Hallie Shoffner 39% Jeff Wadlin 4% |
| Hendrix Collegefor Talk Business & Politics2026-10-08 – 2026-10-13 709 · likely voters | 2026-10-08 – 2026-10-13 | 709 · likely voters | Tom Cotton 50% Hallie Shoffner 41% Jeff Wadlin 5% |
| Grayhouse2026-09-30 – 2026-10-04 550 · likely voters | 2026-09-30 – 2026-10-04 | 550 · likely voters | Hallie Shoffner 40% Tom Cotton 51% Jeff Wadlin 4% |
Now held by Sarah Huckabee Sanders
Counting continues; the result may still change. Fetched 2026-11-16 02:13 UTC. civicAPI
Vote counts come from civicAPI, which gathers the counts published by state election offices; we transcribe them and do not tally.
The state has 4 seats in the US House; its current members are 4 Republicans. Every seat is up for election on November 3.
Counting continues; the result may still change. Fetched 2026-11-16 02:13 UTC. civicAPI
| District | Candidates and votes |
|---|---|
| District 1 | Rick Crawford (Republican, leading) · 127,245 votes 65.4% Terri Yarbrough Green (Democratic) · 60,304 votes 31.0% Steve G. Parsons (Libertarian) · 6,955 votes 3.6% |
| District 2 | French Hill (Republican, leading) · 127,550 votes 50.9% Chris Jones (Democratic) · 123,209 votes 49.1% |
| District 3 | Steve Womack (Republican, leading) · 127,497 votes 54.8% Robb Ryerse (Democratic) · 96,591 votes 41.5% Bobby Wilson (Libertarian) · 8,427 votes 3.6% |
| District 4 | Bruce Westerman (Republican, leading) · 131,470 votes 65.5% James Russell (Democratic) · 69,324 votes 34.5% |
Vote counts come from civicAPI, which gathers the counts published by state election offices; we transcribe them and do not tally.
No related reports for this state yet.
No official results for this state yet.
Now held by Katie Hobbs
Counting continues; the result may still change. Fetched 2026-11-16 02:13 UTC. civicAPI
Vote counts come from civicAPI, which gathers the counts published by state election offices; we transcribe them and do not tally.
The latest three surveys as each pollster published them; we show them as released and do not calculate, weight or average them. Percentages are the share of respondents who say they would vote for each candidate. Surveys differ in timing, sample and method, so their numbers are not directly comparable.
| Pollster | Dates | Sample · population | Share who would vote for the candidate |
|---|---|---|---|
| Noble Predictive Insights2026-10-26 – 2026-10-28 511 · likely voters | 2026-10-26 – 2026-10-28 | 511 · likely voters | Katie Hobbs 51% Andy Biggs 45% Teri Ann Hourihan 1% Risa Lombardo 0% |
| Kreate Strategiespartisan poll (REP) · for American Encore2026-10-25 – 2026-10-27 900 · likely voters | 2026-10-25 – 2026-10-27 | 900 · likely voters | Katie Hobbs 48% Andy Biggs 43% Teri Ann Hourihan 1% Risa Lombardo 1% |
| GrayHouse2026-10-18 – 2026-10-20 550 · likely voters | 2026-10-18 – 2026-10-20 | 550 · likely voters | Katie Hobbs 51% Andy Biggs 45% Teri Ann Hourihan 2% Risa Lombardo 0% |
The state has 9 seats in the US House; its current members are 6 Republicans and 3 Democrats. Every seat is up for election on November 3.
Counting continues; the result may still change. Fetched 2026-11-16 02:13 UTC. civicAPI
| District | Candidates and votes |
|---|---|
| District 1 | Amish Shah (Democratic, leading) · 185,813 votes 52.4% Jay Feely (Republican) · 161,118 votes 45.4% Monica Alponte (Libertarian) · 7,700 votes 2.2% Write-in · 243 votes 0.1% Gage Dylan Thunder (Other) · 15 votes 0.0% Dev Gupta (Independent) · 14 votes 0.0% |
| District 2 | Eli Crane (Republican, leading) · 163,530 votes 49.6% Jonathan Nez (Democratic) · 160,084 votes 48.5% Curtis Goodwin (Libertarian) · 6,042 votes 1.8% Write-in · 201 votes 0.1% |
| District 3 | Yassamin Ansari (Democratic, leading) · 130,716 votes 86.6% Alan Aversa (No Labels) · 9,068 votes 6.0% David Redkey (Green) · 7,782 votes 5.2% Jacob Parkman (Republican) · 2,020 votes 1.3% Write-in · 1,286 votes 0.9% |
| District 4 | Greg Stanton (Democratic, leading) · 159,251 votes 62.3% Zuhdi Jasser (Republican) · 89,811 votes 35.1% Tisha Benoit (No Labels) · 5,986 votes 2.3% Write-in · 493 votes 0.2% Steven Sanders (No Labels) · 70 votes 0.0% |
| District 5 | Mark Lamb (Republican, leading) · 167,969 votes 51.6% Elizabeth Lee (Democratic) · 157,036 votes 48.2% Write-in · 569 votes 0.2% |
| District 6 | JoAnna Mendoza (Democratic, leading) · 190,058 votes 52.9% Juan Ciscomani (Republican) · 160,972 votes 44.8% Jereme Peters (Libertarian) · 4,514 votes 1.3% Gary Swing (Green) · 3,264 votes 0.9% Write-in · 326 votes 0.1% Michael Dorland (Independent) · 90 votes 0.0% |
| District 7 | Adelita Grijalva (Democratic, leading) · 148,177 votes 71.8% Daniel Butierez (Republican) · 57,712 votes 28.0% Write-in · 374 votes 0.2% |
| District 8 | Abraham Hamadeh (Republican, leading) · 147,023 votes 51.1% Bernadette Greene-Placentia (Democratic) · 140,203 votes 48.7% Write-in · 601 votes 0.2% |
| District 9 | Paul Gosar (Republican, leading) · 166,469 votes 57.4% Danielle Sterbinsky (Democratic) · 123,129 votes 42.5% Write-in · 316 votes 0.1% William Perry (Independent) · 47 votes 0.0% G. Seville Hatch (Independent) · 26 votes 0.0% |
Vote counts come from civicAPI, which gathers the counts published by state election offices; we transcribe them and do not tally.
No official results for this state yet.
Now held by Gavin Newsom
Counting continues; the result may still change. Fetched 2026-11-16 02:13 UTC. civicAPI
Vote counts come from civicAPI, which gathers the counts published by state election offices; we transcribe them and do not tally.
The latest three surveys as each pollster published them; we show them as released and do not calculate, weight or average them. Percentages are the share of respondents who say they would vote for each candidate. Surveys differ in timing, sample and method, so their numbers are not directly comparable.
| Pollster | Dates | Sample · population | Share who would vote for the candidate |
|---|---|---|---|
| UC Berkeley Institute of Governmental Studiesfor Los Angeles Times2026-10-19 – 2026-10-25 1,477 · likely voters | 2026-10-19 – 2026-10-25 | 1,477 · likely voters | Xavier Becerra 61% Steve Hilton 34% |
| SurveyUSAfor KGTV (San Diego), The San Diego Union Tribune2026-10-19 – 2026-10-24 799 · likely voters | 2026-10-19 – 2026-10-24 | 799 · likely voters | Xavier Becerra 54% Steve Hilton 32% |
| Emerson College2026-10-17 – 2026-10-19 1,000 · likely voters | 2026-10-17 – 2026-10-19 | 1,000 · likely voters | Xavier Becerra 64% Steve Hilton 36% |
The state has 52 seats in the US House; its current members are 43 Democrats, 8 Republicans and 1 I. Every seat is up for election on November 3.
Counting continues; the result may still change. Fetched 2026-11-16 02:13 UTC. civicAPI
| District | Candidates and votes |
|---|---|
| District 1 | Mike McGuire (Democratic, leading) · 160,012 votes 58.0% James Gallagher (Republican) · 115,826 votes 42.0% |
| District 2 | Jared Huffman (Democratic, leading) · 207,788 votes 66.9% Robin Littau (Republican) · 102,664 votes 33.1% |
| District 3 | Ami Bera (Democratic, leading) · 175,672 votes 58.8% Robb Tucker (Republican) · 123,243 votes 41.2% |
| District 4 | Eric Jones (Democratic, leading) · 130,493 votes 52.5% Mike Thompson (Democratic) · 117,942 votes 47.5% |
| District 5 | Tom McClintock (Republican, leading) · 160,543 votes 55.8% Michael Masuda (Democratic) · 127,226 votes 44.2% |
| District 6 | Richard Pan (Democratic, leading) · 158,747 votes 58.9% Kevin Kiley (No Party Preference) · 110,876 votes 41.1% |
| District 7 | Doris Matsui (Democratic, leading) · 131,972 votes 52.4% Mai Vang (Democratic) · 119,779 votes 47.6% |
| District 8 | John Garamendi (Democratic, leading) · 189,090 votes 73.4% Rudy Recile (Republican) · 68,459 votes 26.6% |
| District 9 | Josh Harder (Democratic, leading) · 142,387 votes 67.1% John McBride (Republican) · 69,842 votes 32.9% |
| District 10 | Mark DeSaulnier (Democratic, leading) · 213,252 votes 69.7% Jeff Frese (Republican) · 92,690 votes 30.3% |
| District 11 | Scott Wiener (Democratic, leading) · 160,400 votes 53.3% Connie Chan (Democratic) · 140,395 votes 46.7% |
| District 12 | Lateefah Simon (Democratic, leading) · 206,896 votes 80.4% Jamie Joyce (Democratic) · 50,416 votes 19.6% |
| District 13 | Adam Gray (Democratic, leading) · 106,405 votes 62.4% Kevin Lincoln (Republican) · 64,158 votes 37.6% |
| District 14 | Aisha Wahab (Democratic, leading) · 122,147 votes 57.6% Melissa Hernandez (Democratic) · 90,077 votes 42.4% |
| District 15 | Kevin Mullin (Democratic, leading) · 196,694 votes 79.9% Charles Hoelter (Republican) · 49,341 votes 20.1% |
| District 16 | Sam Liccardo (Democratic, leading) · 218,744 votes 78.0% Peter Sundin Soulé (Republican) · 61,849 votes 22.0% |
| District 17 | Ro Khanna (Democratic, leading) · 153,632 votes 72.7% Ritesh Tandon (Republican) · 57,658 votes 27.3% |
| District 18 | Zoe Lofgren (Democratic, leading) · 144,327 votes 73.0% Shane Lewis (Republican) · 53,381 votes 27.0% |
| District 19 | Jimmy Panetta (Democratic, leading) · 221,413 votes 72.1% Peter Verbica (Republican) · 85,728 votes 27.9% |
| District 20 | Vince Fong (Republican, leading) · 152,557 votes 61.3% Sandra Van Scotter (Democratic) · 96,320 votes 38.7% |
| District 21 | Jim Costa (Democratic, leading) · 101,829 votes 64.4% Kyle Kirkland (Republican) · 56,177 votes 35.6% |
| District 22 | Randy Villegas (Democratic, leading) · 99,696 votes 67.8% David Valadao (Republican) · 47,355 votes 32.2% |
| District 23 | Jay Obernolte (Republican, leading) · 109,037 votes 50.8% Tessa Lynn Hodge (Democratic) · 105,541 votes 49.2% |
| District 24 | Salud Carbajal (Democratic, leading) · 187,234 votes 66.2% Bob Smith (Republican) · 95,600 votes 33.8% |
| District 25 | Raul Ruiz (Democratic, leading) · 140,371 votes 65.9% Joe Males (Republican) · 72,579 votes 34.1% |
| District 26 | Jacqui Irwin (Democratic, leading) · 164,433 votes 62.9% Sam Gallucci (Republican) · 96,929 votes 37.1% |
| District 27 | George Whitesides (Democratic, leading) · 148,956 votes 64.2% Jason Gibbs (Republican) · 83,037 votes 35.8% |
| District 28 | Judy Chu (Democratic, leading) · 181,333 votes 69.6% April Verlato (Republican) · 79,194 votes 30.4% |
| District 29 | Luz Rivas (Democratic, leading) · 100,088 votes 57.3% Angélica María Dueñas (Democratic) · 74,637 votes 42.7% |
| District 30 | Laura Friedman (Democratic, leading) · 201,469 votes 77.6% Scott Meyers (Republican) · 58,073 votes 22.4% |
| District 31 | Gil Cisneros (Democratic, leading) · 158,126 votes 66.4% Eric Ching (Republican) · 80,047 votes 33.6% |
| District 32 | Brad Sherman (Democratic, leading) · 182,516 votes 67.3% Larry Thompson (Republican) · 88,695 votes 32.7% |
| District 33 | Pete Aguilar (Democratic, leading) · 139,716 votes 68.9% Stephanie Vargas (Republican) · 62,939 votes 31.1% |
| District 34 | Angela Gonzales-Torres (Democratic, leading) · 108,472 votes 62.2% Jimmy Gomez (Democratic) · 65,959 votes 37.8% |
| District 35 | Norma Torres (Democratic, leading) · 139,476 votes 66.8% Mike Cargile (Republican) · 69,185 votes 33.2% |
| District 36 | Ted Lieu (Democratic, leading) · 223,690 votes 73.0% Houston Brignano (Republican) · 82,671 votes 27.0% |
| District 37 | Sydney Kamlager-Dove (Democratic, leading) · 111,409 votes 60.8% Samantha Mota (Democratic) · 71,797 votes 39.2% |
| District 38 | Hilda Solis (Democratic, leading) · 145,246 votes 67.4% Pedro Antonio Casas (Republican) · 70,107 votes 32.6% |
| District 39 | Mark Takano (Democratic, leading) · 129,536 votes 69.0% Steve Manos (Republican) · 58,247 votes 31.0% |
| District 40 | Ken Calvert (Republican, leading) · 129,093 votes 52.6% Young Kim (Republican) · 116,428 votes 47.4% |
| District 41 | Linda Sánchez (Democratic, leading) · 170,959 votes 67.6% Mitch Clemmons (Republican) · 82,001 votes 32.4% |
| District 42 | Robert Garcia (Democratic, leading) · 174,960 votes 61.9% Brian Burley (Republican) · 107,503 votes 38.1% |
| District 43 | Maxine Waters (Democratic, leading) · 155,911 votes 83.0% Cristian Morales (Republican) · 32,027 votes 17.0% |
| District 44 | Nanette Barragán (Democratic, leading) · 148,691 votes 81.8% Genevieve Angel (Republican) · 33,158 votes 18.2% |
| District 45 | Derek Tran (Democratic, leading) · 151,434 votes 61.0% Chuong Vo (Republican) · 96,826 votes 39.0% |
| District 46 | Lou Correa (Democratic, leading) · 139,372 votes 71.5% David Pan (Republican) · 55,441 votes 28.5% |
| District 47 | Dave Min (Democratic, leading) · 166,642 votes 58.6% Jenny Le Roux (Republican) · 117,905 votes 41.4% |
| District 48 | Marni von Wilpert (Democratic, leading) · 160,348 votes 59.5% Jim Desmond (Republican) · 109,250 votes 40.5% |
| District 49 | Mike Levin (Democratic, leading) · 185,741 votes 59.2% Armen Kurdian (Republican) · 128,200 votes 40.8% |
| District 50 | Scott Peters (Democratic, leading) · 190,261 votes 63.4% Steve Cohen (Republican) · 109,853 votes 36.6% |
| District 51 | Sara Jacobs (Democratic, leading) · 184,748 votes 65.9% Ricardo Cabrera (Republican) · 95,532 votes 34.1% |
| District 52 | Juan Vargas (Democratic, leading) · 152,372 votes 71.5% Jeff Belle (Republican) · 60,587 votes 28.5% |
Vote counts come from civicAPI, which gathers the counts published by state election offices; we transcribe them and do not tally.
The Associated PressBloomberg NewsABC NewsNow held by John W. Hickenlooper
Counting continues; the result may still change. Fetched 2026-11-16 02:13 UTC. civicAPI
Vote counts come from civicAPI, which gathers the counts published by state election offices; we transcribe them and do not tally.
The latest three surveys as each pollster published them; we show them as released and do not calculate, weight or average them. Percentages are the share of respondents who say they would vote for each candidate. Surveys differ in timing, sample and method, so their numbers are not directly comparable.
| Pollster | Dates | Sample · population | Share who would vote for the candidate |
|---|---|---|---|
| Lake Research Partnersfor Ballot Initiative Strategy Center2026-09-16 – 2026-09-30 600 · registered voters | 2026-09-16 – 2026-09-30 | 600 · registered voters | John Hickenlooper 52% Mark Baisley 38% |
Now held by Jared Polis
Counting continues; the result may still change. Fetched 2026-11-16 02:13 UTC. civicAPI
Vote counts come from civicAPI, which gathers the counts published by state election offices; we transcribe them and do not tally.
The latest three surveys as each pollster published them; we show them as released and do not calculate, weight or average them. Percentages are the share of respondents who say they would vote for each candidate. Surveys differ in timing, sample and method, so their numbers are not directly comparable.
| Pollster | Dates | Sample · population | Share who would vote for the candidate |
|---|---|---|---|
| Lake Research Partnersfor Ballot Initiative Strategy Center2026-09-16 – 2026-10-30 600 · registered voters | 2026-09-16 – 2026-10-30 | 600 · registered voters | Phil Weiser 51% Victor Marx 36% |
The state has 8 seats in the US House; its current members are 4 Democrats and 4 Republicans. Every seat is up for election on November 3.
Counting continues; the result may still change. Fetched 2026-11-16 02:13 UTC. civicAPI
| District | Candidates and votes |
|---|---|
| District 1 | Melat Kiros (Democratic, leading) · 239,082 votes 78.4% Christy Peterson (Republican) · 43,070 votes 14.1% Shimon Blau (Independent) · 16,650 votes 5.5% Chad Humphrey (Libertarian) · 5,172 votes 1.7% Critter Milton (Unity) · 1,136 votes 0.4% John Wren (Write-In) · 0 votes 0.0% Kevin StClair (Write-In) · 0 votes 0.0% Stephen Replin (Write-In) · 0 votes 0.0% |
| District 2 | Joe Neguse (Democratic, leading) · 278,499 votes 74.7% Kelley Anne Dennison (Republican) · 87,354 votes 23.4% Gaylon Kent (Libertarian) · 7,075 votes 1.9% |
| District 3 | Jeff Hurd (Republican, leading) · 165,497 votes 49.2% Dwayne L. Romero (Democratic) · 159,512 votes 47.5% Cory Robertson (Libertarian) · 5,645 votes 1.7% Clifton Brown (Independent) · 5,400 votes 1.6% |
| District 4 | Eileen Laubacher (Democratic, leading) · 187,745 votes 48.8% Lauren Boebert (Republican) · 184,220 votes 47.9% Douglas Mangeris (Libertarian) · 12,742 votes 3.3% Luis Galvan (Write-In) · 0 votes 0.0% |
| District 5 | Jessica Killin (Democratic, leading) · 157,799 votes 50.7% Jeff Crank (Republican) · 141,984 votes 45.6% Mark "Marky Jr" Elworth (Libertarian) · 6,088 votes 2.0% Christopher Mitchell (American Constitution) · 5,397 votes 1.7% Steven Fuller (Write-In) · 0 votes 0.0% |
| District 6 | Jason Crow (Democratic, leading) · 195,047 votes 65.7% Jason Clark (Republican) · 92,314 votes 31.1% Patty McMahon (Libertarian) · 4,687 votes 1.6% Samir Witta (Independent) · 2,761 votes 0.9% Meredith Ryan (Unity) · 1,916 votes 0.6% |
| District 7 | Brittany Pettersen (Democratic, leading) · 230,008 votes 60.7% Tim Bennett (Republican) · 136,948 votes 36.1% Joe Krzeczkowski (Independent) · 4,539 votes 1.2% Dan "Kilo" Sallis (Libertarian) · 4,216 votes 1.1% Susan Hall (Unity) · 1,802 votes 0.5% Lawrence Kyle Clark (American Constitution) · 1,323 votes 0.3% |
| District 8 | Manny Rutinel (Democratic, leading) · 160,954 votes 55.5% Gabe Evans (Republican) · 117,709 votes 40.6% Dave Wood (Libertarian) · 11,268 votes 3.9% |
Vote counts come from civicAPI, which gathers the counts published by state election offices; we transcribe them and do not tally.
NBC NewsABC NewsThe Associated PressNBC NewsNo official results for this state yet.
Now held by Ned Lamont
Counting continues; the result may still change. Fetched 2026-11-16 02:13 UTC. civicAPI
Vote counts come from civicAPI, which gathers the counts published by state election offices; we transcribe them and do not tally.
The latest three surveys as each pollster published them; we show them as released and do not calculate, weight or average them. Percentages are the share of respondents who say they would vote for each candidate. Surveys differ in timing, sample and method, so their numbers are not directly comparable.
| Pollster | Dates | Sample · population | Share who would vote for the candidate |
|---|---|---|---|
| University of New Hampshire2026-10-27 – 2026-10-31 811 · likely voters | 2026-10-27 – 2026-10-31 | 811 · likely voters | Ned Lamont 54% Ryan Fazio 41% |
| Emerson Collegefor Nexstar Media2026-10-10 – 2026-10-12 800 · likely voters | 2026-10-10 – 2026-10-12 | 800 · likely voters | Ned Lamont 51.4% Ryan Fazio 37.8% |
| Quinnipiac University2026-10-08 – 2026-10-12 702 · likely voters | 2026-10-08 – 2026-10-12 | 702 · likely voters | Ned Lamont 58% Ryan Fazio 38% |
The state has 5 seats in the US House; its current members are 5 Democrats. Every seat is up for election on November 3.
Counting continues; the result may still change. Fetched 2026-11-16 02:13 UTC. civicAPI
| District | Candidates and votes |
|---|---|
| District 1 | Luke Bronin (Democratic, leading) · 170,480 votes 67.3% Amy Chai (Republican) · 78,461 votes 31.0% Mary L. Sanders (Green) · 4,435 votes 1.8% Mark Stewart Greenstein (Write-In) · 17 votes 0.0% |
| District 2 | Joe Courtney (Democratic, leading) · 182,381 votes 62.4% George Austin (Republican) · 109,653 votes 37.5% Kyle Gauck (Write-In) · 30 votes 0.0% |
| District 3 | Rosa DeLauro (Democratic, leading) · 151,261 votes 61.2% Christopher Lancia (Republican) · 87,885 votes 35.6% Thomas Egan (Independent) · 7,322 votes 3.0% Andrew Rice (Write-In) · 663 votes 0.3% |
| District 4 | Jim Himes (Democratic, leading) · 157,485 votes 65.6% Michael Goldstein (Republican) · 78,059 votes 32.5% Benjamin Wesley (Independent) · 4,594 votes 1.9% |
| District 5 | Jahana Hayes (Democratic, leading) · 146,353 votes 57.8% Chris Shea (Republican) · 106,667 votes 42.1% Jonathan DeBarros (Write-In) · 46 votes 0.0% |
Vote counts come from civicAPI, which gathers the counts published by state election offices; we transcribe them and do not tally.
No related reports for this state yet.
No official results for this state yet.
No official results for this state yet.
No related reports for this state yet.
Now held by Christopher A. Coons
Counting continues; the result may still change. Fetched 2026-11-16 02:13 UTC. civicAPI
Vote counts come from civicAPI, which gathers the counts published by state election offices; we transcribe them and do not tally.
Now held by Matt Meyer
No official results for this state yet.
The state has 1 seats in the US House; its current members are 1 Democrat. Every seat is up for election on November 3.
Counting continues; the result may still change. Fetched 2026-11-16 02:13 UTC. civicAPI
| District | Candidates and votes |
|---|---|
| At-large | Sarah McBride (Democratic, leading) · 243,687 votes 64.3% Joseph "Dr. Joe" Arminio (Republican) · 135,016 votes 35.7% |
Vote counts come from civicAPI, which gathers the counts published by state election offices; we transcribe them and do not tally.
No related reports for this state yet.
Now held by Ashley Moody
5429 of 5626 precincts have reported results. The result is not yet certified and may still change. Official count as of 2026-11-06 23:10 UTC. Official state results page
“Reported” counts the units that have sent in results; it is not the share of votes counted. Most states release early and mail ballots first, in batches, and mail ballots may still be counted after Election Day.
Vote counts are transcribed from each state’s official results page; we do not tally them.
The latest three surveys as each pollster published them; we show them as released and do not calculate, weight or average them. Percentages are the share of respondents who say they would vote for each candidate. Surveys differ in timing, sample and method, so their numbers are not directly comparable.
| Pollster | Dates | Sample · population | Share who would vote for the candidate |
|---|---|---|---|
| RedBox Researchpartisan poll (DEM) · for A Fight Worth Having2026-10-30 – 2026-10-31 2,898 · likely voters | 2026-10-30 – 2026-10-31 | 2,898 · likely voters | Ashley Moody 47% Angie Nixon 45% Neil Gillespie 1% |
| ActiVote2026-10-17 – 2026-10-27 400 · likely voters | 2026-10-17 – 2026-10-27 | 400 · likely voters | Ashley Moody 53% Angie Nixon 47% |
| Echelon Insightsfor NetChoice2026-10-16 – 2026-10-23 515 · likely voters | 2026-10-16 – 2026-10-23 | 515 · likely voters | Ashley Moody 51% Angie Nixon 43% Neil Gillespie 3% |
Now held by Ron DeSantis
5429 of 5626 precincts have reported results. The result is not yet certified and may still change. Official count as of 2026-11-06 23:10 UTC. Official state results page
“Reported” counts the units that have sent in results; it is not the share of votes counted. Most states release early and mail ballots first, in batches, and mail ballots may still be counted after Election Day.
Vote counts are transcribed from each state’s official results page; we do not tally them.
The latest three surveys as each pollster published them; we show them as released and do not calculate, weight or average them. Percentages are the share of respondents who say they would vote for each candidate. Surveys differ in timing, sample and method, so their numbers are not directly comparable.
| Pollster | Dates | Sample · population | Share who would vote for the candidate |
|---|---|---|---|
| RedBox Researchfor A Fight Worth Having2026-10-30 – 2026-10-31 2,898 · likely voters | 2026-10-30 – 2026-10-31 | 2,898 · likely voters | Byron Donalds 47% David Jolly 46% Scott Jewett 1% Charles Burkett 0% |
| Echelon Insightsfor NetChoice2026-10-16 – 2026-10-23 515 · likely voters | 2026-10-16 – 2026-10-23 | 515 · likely voters | Byron Donalds 50% David Jolly 44% Scott Jewett 1% |
| co/efficientpartisan poll (REP)2026-10-18 – 2026-10-20 1,014 · likely voters | 2026-10-18 – 2026-10-20 | 1,014 · likely voters | Byron Donalds 49% David Jolly 40% |
The state has 27 seats in the US House; its current members are 20 Republicans and 7 Democrats. Every seat is up for election on November 3.
Counting continues; the result may still change. Fetched 2026-11-16 02:13 UTC. civicAPI
| District | Candidates and votes |
|---|---|
| District 1 | Jimmy Patronis (Republican, leading) · 181,952 votes 62.5% Gay Valimont (Democratic) · 103,752 votes 35.6% Tyler L. Davis (Independent) · 5,337 votes 1.8% |
| District 2 | Austin Rogers (Republican, leading) · 161,188 votes 52.1% Amanda Green (Democratic) · 148,319 votes 47.9% |
| District 3 | Kat Cammack (Republican, leading) · 165,664 votes 55.1% Seth Harp (Democratic) · 129,176 votes 43.0% Mike Klein (Independent) · 5,621 votes 1.9% |
| District 4 | Aaron Bean (Republican, leading) · 151,217 votes 50.2% LaShonda Holloway (Democratic) · 144,926 votes 48.1% Todd Schaefer (Independent) · 3,195 votes 1.1% Mike Sell (Florida Forward Party) · 1,835 votes 0.6% |
| District 5 | John Rutherford (Republican, leading) · 188,076 votes 56.3% Rachel Grage (Democratic) · 145,345 votes 43.5% Write-in · 697 votes 0.2% |
| District 6 | Randy Fine (Republican, leading) · 195,388 votes 58.9% Eric Yonce (Democratic) · 132,374 votes 39.9% Andrew Parrott (Libertarian) · 3,729 votes 1.1% Write-in · 328 votes 0.1% |
| District 7 | Ryan Elijah (Republican, leading) · 161,302 votes 49.7% Bale Dalton (Democratic) · 159,682 votes 49.2% Christopher Dennison (Libertarian) · 3,485 votes 1.1% |
| District 8 | Mike Haridopolos (Republican, leading) · 169,928 votes 53.2% Jennifer Jenkins (Democratic) · 149,667 votes 46.8% |
| District 9 | Darren Soto (Democratic, leading) · 143,329 votes 50.3% Dan Green (Republican) · 141,810 votes 49.7% |
| District 10 | Maxwell Frost (Democratic) · 0 votes |
| District 11 | Joe Strada (Republican, leading) · 193,591 votes 52.9% James Pericola (Democratic) · 168,226 votes 46.0% Ralph Groves (Libertarian) · 3,961 votes 1.1% |
| District 12 | Gus Bilirakis (Republican, leading) · 150,875 votes 52.7% Kimberly Overman (Democratic) · 131,446 votes 45.9% Branden Scrivener (Independent) · 3,790 votes 1.3% |
| District 13 | Anna Paulina Luna (Republican, leading) · 155,189 votes 49.5% Leela Gray (Democratic) · 152,699 votes 48.7% Tony D'Arrigo (Independent) · 5,782 votes 1.8% |
| District 14 | Kathy Castor (Democratic, leading) · 153,785 votes 51.2% Mike Beltran (Republican) · 137,702 votes 45.8% Brian Lambert (Libertarian) · 8,746 votes 2.9% Write-in · 312 votes 0.1% |
| District 15 | Laurel Lee (Republican, leading) · 163,377 votes 54.2% Robert People (Democratic) · 137,547 votes 45.6% Write-in · 450 votes 0.1% |
| District 16 | Sydney Gruters (Republican, leading) · 175,653 votes 51.2% Kelly Kirschner (Democratic) · 161,138 votes 47.0% Mark Davis (Independent) · 6,283 votes 1.8% |
| District 17 | Greg Steube (Republican, leading) · 209,188 votes 58.4% Matthew Montavon (Democratic) · 143,712 votes 40.2% Michael J. Quirk (Independent) · 5,014 votes 1.4% |
| District 18 | Scott Franklin (Republican, leading) · 137,704 votes 50.3% Curtis Gibson (Democratic) · 127,747 votes 46.7% Deva Simmons (Independent) · 8,128 votes 3.0% |
| District 19 | Jim Schwartzel (Republican, leading) · 198,766 votes 61.1% Victor Arias (Democratic) · 122,441 votes 37.6% Seth Haskin (Independent) · 3,998 votes 1.2% Write-in · 52 votes 0.0% |
| District 20 | Debbie Wasserman Schultz (Democratic, leading) · 182,712 votes 74.4% Brent Andersen (Republican) · 53,396 votes 21.7% Kedner Maxime (Independent Party of Florida) · 9,598 votes 3.9% |
| District 21 | Brian Mast (Republican, leading) · 184,334 votes 53.9% James Martin (Democratic) · 153,268 votes 44.8% Alexander Cooke (Independent) · 4,474 votes 1.3% Write-in · 141 votes 0.0% |
| District 22 | Pia Dandiya (Democratic, leading) · 153,183 votes 51.9% Casey Askar (Republican) · 141,943 votes 48.1% |
| District 23 | Lois Frankel (Democratic, leading) · 170,028 votes 65.7% Deborah Adeimy (Republican) · 88,939 votes 34.3% |
| District 24 | Oliver Gilbert (Democratic, leading) · 164,895 votes 80.5% Mayonna Te Brown (Republican) · 39,547 votes 19.3% Write-in · 420 votes 0.2% |
| District 25 | Jared Moskowitz (Democratic, leading) · 143,930 votes 51.2% Scott Singer (Republican) · 130,881 votes 46.6% Peter Jassenoff (Libertarian) · 5,882 votes 2.1% Write-in · 214 votes 0.1% |
| District 26 | Mario Diaz-Balart (Republican, leading) · 114,581 votes 49.9% Nicole Locklin (Democratic) · 112,899 votes 49.1% Deborah Ann Meidinger Hosey (Independent) · 2,352 votes 1.0% |
| District 27 | Maria Elvira Salazar (Republican, leading) · 124,528 votes 50.2% Eliott Rodriguez (Democratic) · 123,438 votes 49.8% |
| District 28 | Carlos Giménez (Republican, leading) · 125,034 votes 52.9% Phil Ehr (Democratic) · 107,907 votes 45.6% Eddy Rojas (Independent) · 3,445 votes 1.5% |
Vote counts come from civicAPI, which gathers the counts published by state election offices; we transcribe them and do not tally.
NBC NewsNBC NewsNBC News Fox News
Now held by Jon Ossoff
159 of 159 counties have reported results (all). The result is not yet certified and may still change. Official count as of 2026-11-12 16:10 UTC. Official state results page
“Reported” counts the units that have sent in results; it is not the share of votes counted. Most states release early and mail ballots first, in batches, and mail ballots may still be counted after Election Day.
Vote counts are transcribed from each state’s official results page; we do not tally them.
The latest three surveys as each pollster published them; we show them as released and do not calculate, weight or average them. Percentages are the share of respondents who say they would vote for each candidate. Surveys differ in timing, sample and method, so their numbers are not directly comparable.
| Pollster | Dates | Sample · population | Share who would vote for the candidate |
|---|---|---|---|
| InsiderAdvantage2026-10-31 – 2026-11-02 2,500 · likely voters | 2026-10-31 – 2026-11-02 | 2,500 · likely voters | Jon Ossoff 53% Mike Collins 46% |
| ActiVote2026-10-06 – 2026-10-20 400 · likely voters | 2026-10-06 – 2026-10-20 | 400 · likely voters | Jon Ossoff 54% Mike Collins 46% |
| Quantus Insights2026-10-15 – 2026-10-17 755 · likely voters | 2026-10-15 – 2026-10-17 | 755 · likely voters | Jon Ossoff 51.8% Mike Collins 44.9% |
Now held by Brian Kemp
159 of 159 counties have reported results (all). The result is not yet certified and may still change. Official count as of 2026-11-12 16:10 UTC. Official state results page
“Reported” counts the units that have sent in results; it is not the share of votes counted. Most states release early and mail ballots first, in batches, and mail ballots may still be counted after Election Day.
Vote counts are transcribed from each state’s official results page; we do not tally them.
The latest three surveys as each pollster published them; we show them as released and do not calculate, weight or average them. Percentages are the share of respondents who say they would vote for each candidate. Surveys differ in timing, sample and method, so their numbers are not directly comparable.
| Pollster | Dates | Sample · population | Share who would vote for the candidate |
|---|---|---|---|
| InsiderAdvantage2026-10-31 – 2026-11-02 2,500 · likely voters | 2026-10-31 – 2026-11-02 | 2,500 · likely voters | Keisha Lance Bottoms 49.03% Rick Jackson 49% |
| Echelon Insightsfor NetChoice2026-10-16 – 2026-10-23 508 · likely voters | 2026-10-16 – 2026-10-23 | 508 · likely voters | Keisha Lance Bottoms 49% Rick Jackson 48% |
| ActiVote2026-10-06 – 2026-10-20 400 · likely voters | 2026-10-06 – 2026-10-20 | 400 · likely voters | Keisha Lance Bottoms 48.5% Rick Jackson 51.5% |
The state has 14 seats in the US House; its current members are 9 Republicans and 5 Democrats. Every seat is up for election on November 3.
Counting continues; the result may still change. Fetched 2026-11-16 02:13 UTC. civicAPI
| District | Candidates and votes |
|---|---|
| District 1 | Jim Kingston (Republican, leading) · 140,266 votes 51.4% Amanda Hollowell (Democratic) · 132,609 votes 48.6% |
| District 2 | Sanford Bishop (Democratic, leading) · 148,422 votes 60.8% Matt Day (Republican) · 95,638 votes 39.2% |
| District 3 | Brian Jack (Republican, leading) · 188,624 votes 58.6% Maura Keller (Democratic) · 133,240 votes 41.4% |
| District 4 | Hank Johnson (Democratic, leading) · 217,340 votes 82.6% James Duffie (Republican) · 45,644 votes 17.4% |
| District 5 | Nikema Williams (Democratic, leading) · 274,922 votes 90.2% John Salvesen (Republican) · 29,862 votes 9.8% |
| District 6 | Lucy McBath (Democratic, leading) · 264,024 votes 80.9% Kevin Martin (Republican) · 62,379 votes 19.1% |
| District 7 | Rich McCormick (Republican, leading) · 191,624 votes 56.2% Anthony Kozycki (Democratic) · 149,457 votes 43.8% |
| District 8 | Austin Scott (Republican, leading) · 160,171 votes 60.4% Kelly Esti (Democratic) · 105,005 votes 39.6% |
| District 9 | Andrew Clyde (Republican, leading) · 182,986 votes 59.3% Caitlyn Gegen (Democratic) · 125,653 votes 40.7% |
| District 10 | Houston Gaines (Republican, leading) · 174,843 votes 53.6% Pamela DeLancy (Democratic) · 151,125 votes 46.4% |
| District 11 | John Cowan (Republican, leading) · 182,230 votes 55.4% Chris Harden (Democratic) · 146,967 votes 44.6% |
| District 12 | Rick Allen (Republican, leading) · 140,896 votes 52.1% Ceretta Smith (Democratic) · 129,621 votes 47.9% |
| District 13 | Jasmine Clark (Democratic, leading) · 248,094 votes 79.8% Jonathan Chavez (Republican) · 62,680 votes 20.2% |
| District 14 | Clay Fuller (Republican, leading) · 168,830 votes 58.8% Shawn Harris (Democratic) · 118,446 votes 41.2% |
Vote counts come from civicAPI, which gathers the counts published by state election offices; we transcribe them and do not tally.
ABC NewsABC News Ars Technica
No official results for this state yet.
Now held by Josh Green
Counting continues; the result may still change. Fetched 2026-11-16 02:13 UTC. civicAPI
Vote counts come from civicAPI, which gathers the counts published by state election offices; we transcribe them and do not tally.
The state has 2 seats in the US House; its current members are 2 Democrats. Every seat is up for election on November 3.
Counting continues; the result may still change. Fetched 2026-11-16 02:13 UTC. civicAPI
| District | Candidates and votes |
|---|---|
| District 1 | Ed Case (Democratic, leading) · 126,337 votes 71.8% Adriel Lam (Republican) · 40,308 votes 22.9% Jordan S. Conley (Green) · 7,011 votes 4.0% Nathan M. Berning (Nonpartisan) · 2,348 votes 1.3% |
| District 2 | Jill Tokuda (Democratic, leading) · 129,931 votes 66.5% Brenton Awa (Republican) · 65,441 votes 33.5% |
Vote counts come from civicAPI, which gathers the counts published by state election offices; we transcribe them and do not tally.
No related reports for this state yet.
Now held by Joni Ernst
1656 of 1656 precincts have reported results (all). The result is not yet certified and may still change. Official count as of 2026-11-13 22:23 UTC. Official state results page
“Reported” counts the units that have sent in results; it is not the share of votes counted. Most states release early and mail ballots first, in batches, and mail ballots may still be counted after Election Day.
Vote counts are transcribed from each state’s official results page; we do not tally them.
The latest three surveys as each pollster published them; we show them as released and do not calculate, weight or average them. Percentages are the share of respondents who say they would vote for each candidate. Surveys differ in timing, sample and method, so their numbers are not directly comparable.
| Pollster | Dates | Sample · population | Share who would vote for the candidate |
|---|---|---|---|
| The New York Times/Siena University2026-10-26 – 2026-11-01 705 · likely voters | 2026-10-26 – 2026-11-01 | 705 · likely voters | Josh Turek 48% Ashley Hinson 47% |
| GrayHouse2026-10-28 – 2026-10-31 601 · likely voters | 2026-10-28 – 2026-10-31 | 601 · likely voters | Ashley Hinson 48% Josh Turek 46% Thomas Laehn 2% |
| co/efficientpartisan poll (REP)2026-10-28 – 2026-10-28 1,020 · likely voters | 2026-10-28 – 2026-10-28 | 1,020 · likely voters | Ashley Hinson 48% Josh Turek 46% Thomas Laehn 1% |
Now held by Kim Reynolds
1656 of 1656 precincts have reported results (all). The result is not yet certified and may still change. Official count as of 2026-11-13 22:23 UTC. Official state results page
“Reported” counts the units that have sent in results; it is not the share of votes counted. Most states release early and mail ballots first, in batches, and mail ballots may still be counted after Election Day.
Vote counts are transcribed from each state’s official results page; we do not tally them.
The latest three surveys as each pollster published them; we show them as released and do not calculate, weight or average them. Percentages are the share of respondents who say they would vote for each candidate. Surveys differ in timing, sample and method, so their numbers are not directly comparable.
| Pollster | Dates | Sample · population | Share who would vote for the candidate |
|---|---|---|---|
| The New York Times/Siena University2026-10-26 – 2026-11-01 705 · likely voters | 2026-10-26 – 2026-11-01 | 705 · likely voters | Rob Sand 51% Zach Lahn 43% |
| YouGov2026-10-26 – 2026-10-29 2,020 · likely voters | 2026-10-26 – 2026-10-29 | 2,020 · likely voters | Rob Sand 53% Zach Lahn 46% |
| co/efficientpartisan poll (REP)2026-10-28 – 2026-10-28 1,020 · likely voters | 2026-10-28 – 2026-10-28 | 1,020 · likely voters | Rob Sand 50% Zach Lahn 45% |
The state has 4 seats in the US House; its current members are 4 Republicans. Every seat is up for election on November 3.
Counting continues; the result may still change. Fetched 2026-11-16 02:13 UTC. civicAPI
| District | Candidates and votes |
|---|---|
| District 1 | Christina Bohannan (Democratic, leading) · 184,006 votes 53.0% Mariannette Miller-Meeks (Republican) · 150,719 votes 43.4% Michael Bridgford (Independent) · 12,376 votes 3.6% Write-in · 287 votes 0.1% |
| District 2 | Lindsay James (Democratic, leading) · 171,577 votes 49.5% Joe Mitchell (Republican) · 157,775 votes 45.5% Rick Stewart (Libertarian) · 9,505 votes 2.7% Dave Bushaw (Independent) · 7,477 votes 2.2% Write-in · 226 votes 0.1% |
| District 3 | Sarah Trone Garriott (Democratic, leading) · 189,435 votes 53.5% Zach Nunn (Republican) · 163,687 votes 46.2% Write-in · 869 votes 0.2% |
| District 4 | Chris McGowan (Republican, leading) · 178,959 votes 59.0% Dave Dawson (Democratic) · 124,128 votes 40.9% Write-in · 402 votes 0.1% |
Vote counts come from civicAPI, which gathers the counts published by state election offices; we transcribe them and do not tally.
Ars TechnicaNow held by James E. Risch
Counting continues; the result may still change. Fetched 2026-11-16 02:13 UTC. civicAPI
Vote counts come from civicAPI, which gathers the counts published by state election offices; we transcribe them and do not tally.
The latest three surveys as each pollster published them; we show them as released and do not calculate, weight or average them. Percentages are the share of respondents who say they would vote for each candidate. Surveys differ in timing, sample and method, so their numbers are not directly comparable.
| Pollster | Dates | Sample · population | Share who would vote for the candidate |
|---|---|---|---|
| The Bullfinch Group2026-08-04 – 2026-08-07 608 · likely voters | 2026-08-04 – 2026-08-07 | 608 · likely voters | Jim Risch 34% Todd Achilles 30% Matt Loesby 4% |
Now held by Brad Little
Counting continues; the result may still change. Fetched 2026-11-16 02:13 UTC. civicAPI
Vote counts come from civicAPI, which gathers the counts published by state election offices; we transcribe them and do not tally.
The state has 2 seats in the US House; its current members are 2 Republicans. Every seat is up for election on November 3.
Counting continues; the result may still change. Fetched 2026-11-16 02:13 UTC. civicAPI
| District | Candidates and votes |
|---|---|
| District 1 | Russ Fulcher (Republican, leading) · 244,717 votes 64.2% Kaylee Peterson (Democratic) · 110,112 votes 28.9% Sarah Zabel Peterson (Independent) · 23,106 votes 6.1% Brendan Gomez (Constitution) · 3,421 votes 0.9% |
| District 2 | Mike Simpson (Republican, leading) · 170,868 votes 51.7% Ellie Gilbreath (Democratic) · 133,156 votes 40.3% Tripp Hutchinson (Independent) · 11,641 votes 3.5% Emre Houser (Independent) · 7,857 votes 2.4% Will Johanson (Libertarian) · 7,145 votes 2.2% |
Vote counts come from civicAPI, which gathers the counts published by state election offices; we transcribe them and do not tally.
Now held by Richard J. Durbin
Counting continues; the result may still change. Fetched 2026-11-16 02:13 UTC. civicAPI
Vote counts come from civicAPI, which gathers the counts published by state election offices; we transcribe them and do not tally.
The latest three surveys as each pollster published them; we show them as released and do not calculate, weight or average them. Percentages are the share of respondents who say they would vote for each candidate. Surveys differ in timing, sample and method, so their numbers are not directly comparable.
| Pollster | Dates | Sample · population | Share who would vote for the candidate |
|---|---|---|---|
| ActiVote2026-10-21 – 2026-10-30 400 · likely voters | 2026-10-21 – 2026-10-30 | 400 · likely voters | Juliana Stratton 55.6% Don Tracy 44.4% |
| ActiVote2026-09-26 – 2026-10-20 400 · likely voters | 2026-09-26 – 2026-10-20 | 400 · likely voters | Juliana Stratton 59% Don Tracy 42% |
| Public Policy Pollingpartisan poll (DEM) · for Chicago News Weekly2026-09-30 – 2026-10-01 569 · likely voters | 2026-09-30 – 2026-10-01 | 569 · likely voters | Juliana Stratton 49% Don Tracy 36% |
Now held by JB Pritzker
Counting continues; the result may still change. Fetched 2026-11-16 02:13 UTC. civicAPI
Vote counts come from civicAPI, which gathers the counts published by state election offices; we transcribe them and do not tally.
The latest three surveys as each pollster published them; we show them as released and do not calculate, weight or average them. Percentages are the share of respondents who say they would vote for each candidate. Surveys differ in timing, sample and method, so their numbers are not directly comparable.
| Pollster | Dates | Sample · population | Share who would vote for the candidate |
|---|---|---|---|
| ActiVote2026-10-02 – 2026-10-22 400 · likely voters | 2026-10-02 – 2026-10-22 | 400 · likely voters | JB Pritzker 58.7% Darren Bailey 41.3% |
| Victory Research2025-11-20 – 2025-11-24 1,208 · likely voters | 2025-11-20 – 2025-11-24 | 1,208 · likely voters | JB Pritzker 54% Darren Bailey 34% |
The state has 17 seats in the US House; its current members are 14 Democrats and 3 Republicans. Every seat is up for election on November 3.
Counting continues; the result may still change. Fetched 2026-11-16 02:13 UTC. civicAPI
| District | Candidates and votes |
|---|---|
| District 1 | Jonathan Jackson (Democratic, leading) · 175,009 votes 72.6% Christian Maxwell (Republican) · 66,199 votes 27.4% |
| District 2 | Donna Miller (Democratic, leading) · 159,777 votes 73.6% Mike Noack (Republican) · 57,312 votes 26.4% |
| District 3 | Delia Ramirez (Democratic, leading) · 158,349 votes 77.5% Angel Oakley (Republican) · 45,892 votes 22.5% |
| District 4 | Patty Garcia (Democratic, leading) · 116,260 votes 71.3% Lupe Castillo (Republican) · 25,836 votes 15.9% Chris Getty (Independent) · 14,920 votes 9.2% Ed Hershey (Working Class Party) · 5,970 votes 3.7% |
| District 5 | Mike Quigley (Democratic, leading) · 215,847 votes 77.3% Tom Hanson (Republican) · 63,460 votes 22.7% |
| District 6 | Sean Casten (Democratic, leading) · 168,753 votes 63.0% Niki Conforti (Republican) · 99,299 votes 37.0% |
| District 7 | La Shawn Ford (Democratic, leading) · 186,765 votes 89.3% Chad Koppie (Republican) · 22,272 votes 10.7% |
| District 8 | Melissa Bean (Democratic, leading) · 138,741 votes 64.3% Jennifer Davis (Republican) · 76,887 votes 35.7% |
| District 9 | Daniel K. Biss (Democratic, leading) · 202,550 votes 76.9% John Elleson (Republican) · 60,747 votes 23.1% |
| District 10 | Brad Schneider (Democratic, leading) · 168,886 votes 70.3% Carl Lambrecht (Republican) · 71,236 votes 29.7% |
| District 11 | Bill Foster (Democratic, leading) · 171,344 votes 64.3% Jeffrey Walter (Republican) · 95,124 votes 35.7% |
| District 12 | Mike Bost (Republican, leading) · 195,813 votes 69.5% Julie Fortier (Democratic) · 85,843 votes 30.5% |
| District 13 | Nikki Budzinski (Democratic, leading) · 158,019 votes 62.7% Jeff Wilson (Republican) · 94,026 votes 37.3% |
| District 14 | Lauren Underwood (Democratic, leading) · 153,408 votes 62.6% James Marter (Republican) · 91,758 votes 37.4% |
| District 15 | Mary Miller (Republican, leading) · 192,713 votes 66.9% Jennifer Todd (Democratic) · 95,354 votes 33.1% |
| District 16 | Darin LaHood (Republican, leading) · 173,330 votes 58.8% Paul Nolley (Democratic) · 121,569 votes 41.2% |
| District 17 | Eric Sorensen (Democratic, leading) · 142,041 votes 60.2% Dillan Vancil (Republican) · 94,042 votes 39.8% |
Vote counts come from civicAPI, which gathers the counts published by state election offices; we transcribe them and do not tally.
No related reports for this state yet.
No official results for this state yet.
Now held by Mike Braun
No official results for this state yet.
The state has 9 seats in the US House; its current members are 7 Republicans and 2 Democrats. Every seat is up for election on November 3.
Counting continues; the result may still change. Fetched 2026-11-16 02:13 UTC. civicAPI
| District | Candidates and votes |
|---|---|
| District 1 | Frank Mrvan (Democratic, leading) · 140,440 votes 62.9% Barb Regnitz (Republican) · 82,851 votes 37.1% Alexander R (Alex) Degman (Independent) · 11 votes 0.0% Prescription Dope Deaths Johnson, Jr (Write-In) · 8 votes 0.0% |
| District 2 | Rudy Yakym (Republican, leading) · 98,843 votes 51.2% Jamee Decio (Democratic) · 89,179 votes 46.1% William Henry (Libertarian) · 5,217 votes 2.7% |
| District 3 | Marlin Stutzman (Republican, leading) · 109,737 votes 54.9% Kelly Thompson (Democratic) · 90,253 votes 45.1% Phillip D. Beachy (Phil) (Independent) · 46 votes 0.0% |
| District 4 | Jim Baird (Republican, leading) · 115,173 votes 54.2% Drew Cox (Democratic) · 97,223 votes 45.7% David E. Bokash (Independent) · 137 votes 0.1% |
| District 5 | J. D. Ford (Democratic, leading) · 134,497 votes 51.7% Victoria Spartz (Republican) · 125,872 votes 48.3% |
| District 6 | Jefferson Shreve (Republican, leading) · 111,179 votes 55.1% Cinde Wirth (Democratic) · 90,672 votes 44.9% |
| District 7 | André Carson (Democratic, leading) · 159,348 votes 77.0% Patrick McAuley (Republican) · 42,252 votes 20.4% James Sceniak (Libertarian) · 5,453 votes 2.6% |
| District 8 | Mark Messmer (Republican, leading) · 117,716 votes 55.2% Mary Allen (Democratic) · 95,373 votes 44.8% |
| District 9 | Erin Houchin (Republican, leading) · 122,201 votes 54.1% Brad Meyer (Democratic) · 98,233 votes 43.5% Tonya Hudson (Libertarian) · 5,520 votes 2.4% Floyd Michael Taylor (Independent) · 53 votes 0.0% |
Vote counts come from civicAPI, which gathers the counts published by state election offices; we transcribe them and do not tally.
No related reports for this state yet.
Now held by Roger Marshall
Counting continues; the result may still change. Fetched 2026-11-16 02:13 UTC. civicAPI
Vote counts come from civicAPI, which gathers the counts published by state election offices; we transcribe them and do not tally.
The latest three surveys as each pollster published them; we show them as released and do not calculate, weight or average them. Percentages are the share of respondents who say they would vote for each candidate. Surveys differ in timing, sample and method, so their numbers are not directly comparable.
| Pollster | Dates | Sample · population | Share who would vote for the candidate |
|---|---|---|---|
| Survey 1602026-10-27 – 2026-11-01 1,365 · likely voters | 2026-10-27 – 2026-11-01 | 1,365 · likely voters | Roger Marshall 43% Adam Hamilton 50% |
| CNN/SSRS2026-10-20 – 2026-10-26 838 · likely voters | 2026-10-20 – 2026-10-26 | 838 · likely voters | Roger Marshall 45% Adam Hamilton 49% |
| InsiderAdvantage2026-10-13 – 2026-10-14 1,200 · likely voters | 2026-10-13 – 2026-10-14 | 1,200 · likely voters | Roger Marshall 48% Adam Hamilton 47% |
Now held by Laura Kelly
Counting continues; the result may still change. Fetched 2026-11-16 02:13 UTC. civicAPI
Vote counts come from civicAPI, which gathers the counts published by state election offices; we transcribe them and do not tally.
The latest three surveys as each pollster published them; we show them as released and do not calculate, weight or average them. Percentages are the share of respondents who say they would vote for each candidate. Surveys differ in timing, sample and method, so their numbers are not directly comparable.
| Pollster | Dates | Sample · population | Share who would vote for the candidate |
|---|---|---|---|
| Survey 1602026-10-27 – 2026-11-01 1,267 · likely voters | 2026-10-27 – 2026-11-01 | 1,267 · likely voters | Ty Masterson 47% Cindy Holscher 49% |
| The New York Times/Siena University2026-10-27 – 2026-11-01 736 · likely voters | 2026-10-27 – 2026-11-01 | 736 · likely voters | Ty Masterson 47% Cindy Holscher 48% |
| YouGov2026-10-26 – 2026-10-29 2,092 · likely voters | 2026-10-26 – 2026-10-29 | 2,092 · likely voters | Ty Masterson 50% Cindy Holscher 49% |
The state has 4 seats in the US House; its current members are 3 Republicans and 1 Democrat. Every seat is up for election on November 3.
Counting continues; the result may still change. Fetched 2026-11-16 02:13 UTC. civicAPI
| District | Candidates and votes |
|---|---|
| District 1 | Tracey Mann (Republican, leading) · 150,544 votes 59.4% Lauren Reinhold (Democratic) · 95,911 votes 37.9% Steven Jacob (Libertarian) · 6,863 votes 2.7% |
| District 2 | Derek Schmidt (Republican, leading) · 125,843 votes 51.2% Don Coover (Democratic) · 110,677 votes 45.0% John Hauer (Libertarian) · 9,201 votes 3.7% |
| District 3 | Sharice Davids (Democratic, leading) · 201,050 votes 59.6% Eric Jenkins (Republican) · 129,537 votes 38.4% Steven A Hohe (Libertarian) · 6,922 votes 2.1% |
| District 4 | Ron Estes (Republican, leading) · 139,155 votes 53.5% Katy Tyndell (Democratic) · 114,568 votes 44.1% Drew Cranmer (Libertarian) · 6,187 votes 2.4% |
Vote counts come from civicAPI, which gathers the counts published by state election offices; we transcribe them and do not tally.
NBC NewsCNNNBC NewsNBC NewsNow held by Mitch McConnell
Counting continues; the result may still change. Fetched 2026-11-16 02:13 UTC. civicAPI
Vote counts come from civicAPI, which gathers the counts published by state election offices; we transcribe them and do not tally.
Now held by Andy Beshear
No official results for this state yet.
The state has 6 seats in the US House; its current members are 5 Republicans and 1 Democrat. Every seat is up for election on November 3.
Counting continues; the result may still change. Fetched 2026-11-16 02:13 UTC. civicAPI
| District | Candidates and votes |
|---|---|
| District 1 | James Comer (Republican, leading) · 153,992 votes 67.6% Drew Williams (Democratic) · 73,910 votes 32.4% Write-in · 0 votes 0.0% |
| District 2 | Brett Guthrie (Republican, leading) · 145,139 votes 62.8% Megan Wingfield (Democratic) · 81,111 votes 35.1% Thomas A. Loecken (Independent) · 4,807 votes 2.1% Write-in · 0 votes 0.0% |
| District 3 | Morgan McGarvey (Democratic, leading) · 174,775 votes 70.3% Maria Teresa Rodriguez (Republican) · 73,717 votes 29.7% Write-in · 0 votes 0.0% |
| District 4 | Ed Gallrein (Republican, leading) · 137,623 votes 54.2% Melissa Strange (Democratic) · 103,713 votes 40.9% Jeremy Todd (Libertarian) · 12,484 votes 4.9% Write-in · 0 votes 0.0% |
| District 5 | Hal Rogers (Republican, leading) · 139,808 votes 71.1% Ned Pillersdorf (Democratic) · 49,805 votes 25.3% Mikel Wein (Independent) · 4,117 votes 2.1% Gerardo Serrano (Independent) · 2,738 votes 1.4% Write-in · 38 votes 0.0% |
| District 6 | Zach Dembo (Democratic, leading) · 138,777 votes 52.7% Ralph Alvarado (Republican) · 114,030 votes 43.3% Jay J. Bowman (Independent) · 6,710 votes 2.5% Pete Lynch (Kentucky Party) · 3,836 votes 1.5% Write-in · 0 votes 0.0% |
Vote counts come from civicAPI, which gathers the counts published by state election offices; we transcribe them and do not tally.
No related reports for this state yet.
Now held by Bill Cassidy
Counting continues; the result may still change. Fetched 2026-11-16 02:13 UTC. civicAPI
Vote counts come from civicAPI, which gathers the counts published by state election offices; we transcribe them and do not tally.
Now held by Jeff Landry
No official results for this state yet.
The state has 6 seats in the US House; its current members are 4 Republicans and 2 Democrats. Every seat is up for election on November 3.
Counting continues; the result may still change. Fetched 2026-11-16 02:13 UTC. civicAPI
| District | Candidates and votes |
|---|---|
| District 1 | Steve Scalise (Republican, leading) · 159,896 votes 60.7% Lauren Jewett (Democratic) · 89,440 votes 34.0% Randall Arrington (Republican) · 9,776 votes 3.7% E. "Liddy" Glass (Nonpartisan) · 4,279 votes 1.6% |
| District 2 | Troy Carter (Democratic, leading) · 192,286 votes 79.9% Peter Williams (Republican) · 36,369 votes 15.1% Lisa Ballay (Libertarian) · 6,409 votes 2.7% Renada Collins (Nonpartisan) · 2,999 votes 1.2% Walter "Rocky" Beach (Nonpartisan) · 2,553 votes 1.1% |
| District 3 | Clay Higgins (Republican, leading) · 129,203 votes 55.0% John Day (Democratic) · 49,163 votes 20.9% Caleb Walker (Democratic) · 19,932 votes 8.5% Priscilla Gonzalez (Democratic) · 16,828 votes 7.2% Kate Cotten (Republican) · 15,661 votes 6.7% Tia LeBrun (Nonpartisan) · 4,208 votes 1.8% |
| District 4 | Mike Johnson (Republican, leading) · 134,750 votes 58.5% Conrad Cable (Democratic) · 52,899 votes 23.0% Matt Gromlich (Democratic) · 32,868 votes 14.3% Mike Nichols (Republican) · 7,271 votes 3.2% Gordon Heslop (Republican) · 2,571 votes 1.1% |
| District 5 | Patricia "Pat" Moore (Democratic, leading) · 40,786 votes 17.9% Gabe Firment (Republican) · 39,126 votes 17.2% Misti Cordell (Republican) · 33,371 votes 14.6% Michael Echols (Republican) · 32,905 votes 14.4% Stewart Cathey, Jr. (Republican) · 28,168 votes 12.4% Antonio Wilson (Democratic) · 27,373 votes 12.0% Dan McKay (Democratic) · 16,051 votes 7.0% Austin Magee (Republican) · 7,910 votes 3.5% Oscar "Omar" Dantzler (Republican) · 2,233 votes 1.0% |
| District 6 | Chauna Banks (Democratic, leading) · 51,004 votes 19.4% Blake Miguez (Republican) · 50,376 votes 19.2% Rick Edmonds (Republican) · 49,420 votes 18.8% Lindsay Garcia (Democratic) · 33,632 votes 12.8% Stephen Wagley (Republican) · 28,239 votes 10.7% Patrick "Pat" Forbes (Democratic) · 23,869 votes 9.1% Larry Davis (Republican) · 11,388 votes 4.3% Monique Appeaning (Republican) · 8,139 votes 3.1% Rufus Craig (Libertarian) · 3,478 votes 1.3% Michael Mebruer (Republican) · 3,167 votes 1.2% |
Vote counts come from civicAPI, which gathers the counts published by state election offices; we transcribe them and do not tally.
No related reports for this state yet.
Now held by Edward J. Markey
Counting continues; the result may still change. Fetched 2026-11-16 02:13 UTC. civicAPI
Vote counts come from civicAPI, which gathers the counts published by state election offices; we transcribe them and do not tally.
The latest three surveys as each pollster published them; we show them as released and do not calculate, weight or average them. Percentages are the share of respondents who say they would vote for each candidate. Surveys differ in timing, sample and method, so their numbers are not directly comparable.
| Pollster | Dates | Sample · population | Share who would vote for the candidate |
|---|---|---|---|
| University of Massachusetts Lowell Center for Public Opinion/YouGov2026-10-07 – 2026-10-18 850 · likely voters | 2026-10-07 – 2026-10-18 | 850 · likely voters | Ed Markey 55% John Deaton 26% |
| University of Massachusetts Department of Political Science/YouGovfor WCVB-TV2026-08-05 – 2026-08-12 800 · registered voters | 2026-08-05 – 2026-08-12 | 800 · registered voters | Ed Markey 51% John Deaton 30% |
| Suffolk Universityfor The Boston Globe2026-06-08 – 2026-06-12 500 · registered voters | 2026-06-08 – 2026-06-12 | 500 · registered voters | Ed Markey 55% John Deaton 30% |
Now held by Maura Healey
Counting continues; the result may still change. Fetched 2026-11-16 02:13 UTC. civicAPI
Vote counts come from civicAPI, which gathers the counts published by state election offices; we transcribe them and do not tally.
The latest three surveys as each pollster published them; we show them as released and do not calculate, weight or average them. Percentages are the share of respondents who say they would vote for each candidate. Surveys differ in timing, sample and method, so their numbers are not directly comparable.
| Pollster | Dates | Sample · population | Share who would vote for the candidate |
|---|---|---|---|
| Suffolk Universityfor The Boston Globe2026-06-08 – 2026-06-12 500 · registered voters | 2026-06-08 – 2026-06-12 | 500 · registered voters | Maura Healey 56% Mike Minogue 31% |
The state has 9 seats in the US House; its current members are 9 Democrats. Every seat is up for election on November 3.
Counting continues; the result may still change. Fetched 2026-11-16 02:13 UTC. civicAPI
| District | Candidates and votes |
|---|---|
| District 1 | Richard E. Neal (Democratic, leading) · 177,556 votes 65.4% Nadia Donya Milleron (Independent/Unenrolled) · 93,791 votes 34.6% |
| District 2 | James P. McGovern (Democratic, leading) · 198,782 votes 100.0% |
| District 3 | Lori Loureiro Trahan (Democratic, leading) · 174,853 votes 67.2% Gary J. Grossi (Republican) · 78,849 votes 30.3% Dennis R. Conlon (Unenrolled) · 6,488 votes 2.5% |
| District 4 | Jake Auchincloss (Democratic, leading) · 192,770 votes 66.4% Thomas Stalcup (Republican) · 97,619 votes 33.6% |
| District 5 | Katherine M. Clark (Democratic, leading) · 206,925 votes 100.0% |
| District 6 | Dan Koh (Democratic, leading) · 206,308 votes 63.4% Micah Quinney Jones (Republican) · 119,144 votes 36.6% |
| District 7 | Ayanna S. Pressley (Democratic, leading) · 158,384 votes 100.0% |
| District 8 | Stephen F. Lynch (Democratic, leading) · 195,606 votes 69.4% Robert G. Burke (Republican) · 75,619 votes 26.8% Rasheed Nicholas Walters (Independent) · 10,579 votes 3.8% |
| District 9 | Bill Keating (Democratic, leading) · 213,587 votes 60.9% R. Tyler Macallister (Republican) · 137,282 votes 39.1% |
Vote counts come from civicAPI, which gathers the counts published by state election offices; we transcribe them and do not tally.
No official results for this state yet.
Now held by Wes Moore
Counting continues; the result may still change. Fetched 2026-11-16 02:14 UTC. civicAPI
Vote counts come from civicAPI, which gathers the counts published by state election offices; we transcribe them and do not tally.
The latest three surveys as each pollster published them; we show them as released and do not calculate, weight or average them. Percentages are the share of respondents who say they would vote for each candidate. Surveys differ in timing, sample and method, so their numbers are not directly comparable.
| Pollster | Dates | Sample · population | Share who would vote for the candidate |
|---|---|---|---|
| University of Maryland Baltimore County Institute of Politics2026-09-22 – 2026-09-27 776 · likely voters | 2026-09-22 – 2026-09-27 | 776 · likely voters | Wes Moore 51% Dan Cox 24% Andy Ellis 3% Cathy White 3% |
| Zenith Researchpartisan poll (DEM) · for Perry Jacobson, Blended Public Affairs2026-07-27 – 2026-08-03 800 · likely voters | 2026-07-27 – 2026-08-03 | 800 · likely voters | Wes Moore 58% Dan Cox 31% |
The state has 8 seats in the US House; its current members are 7 Democrats and 1 Republican. Every seat is up for election on November 3.
Counting continues; the result may still change. Fetched 2026-11-16 02:14 UTC. civicAPI
| District | Candidates and votes |
|---|---|
| District 1 | Andy Harris (Republican, leading) · 165,256 votes 52.1% Dan Schwartz (Democratic) · 151,285 votes 47.7% Write-in · 480 votes 0.2% Edward Shlikas (Write-In) · 62 votes 0.0% |
| District 2 | Johnny Olszewski (Democratic, leading) · 189,618 votes 65.0% Dave Wallace (Republican) · 101,446 votes 34.8% Write-in · 601 votes 0.2% |
| District 3 | Sarah Elfreth (Democratic, leading) · 211,989 votes 67.7% Berney Flowers (Republican) · 100,054 votes 32.0% Write-in · 860 votes 0.3% Robert L. Coffman (Write-In) · 31 votes 0.0% |
| District 4 | Glenn Ivey (Democratic, leading) · 177,336 votes 89.2% George McDermott (Republican) · 11,889 votes 6.0% Sam Husseini (Green) · 9,166 votes 4.6% Write-in · 321 votes 0.2% |
| District 5 | Adrian Boafo (Democratic, leading) · 226,262 votes 70.5% Chris Chaffee (Republican) · 92,317 votes 28.8% Write-in · 2,256 votes 0.7% Mildred Marie Hall (Write-In) · 53 votes 0.0% |
| District 6 | April McClain Delaney (Democratic, leading) · 161,140 votes 58.9% Robin Ficker (Republican) · 104,077 votes 38.1% Moshe Y. Landman (Green) · 7,606 votes 2.8% Write-in · 673 votes 0.2% |
| District 7 | Kweisi Mfume (Democratic, leading) · 182,284 votes 84.9% Scott Collier (Republican) · 31,505 votes 14.7% Write-in · 841 votes 0.4% |
| District 8 | Jamie Raskin (Democratic, leading) · 229,736 votes 83.3% Cheryl Riley (Republican) · 40,848 votes 14.8% Nancy Wallace (Green) · 4,666 votes 1.7% Write-in · 507 votes 0.2% |
Vote counts come from civicAPI, which gathers the counts published by state election offices; we transcribe them and do not tally.
No related reports for this state yet.
Now held by Susan M. Collins
Counting continues; the result may still change. Fetched 2026-11-16 02:14 UTC. civicAPI
Vote counts come from civicAPI, which gathers the counts published by state election offices; we transcribe them and do not tally.
The latest three surveys as each pollster published them; we show them as released and do not calculate, weight or average them. Percentages are the share of respondents who say they would vote for each candidate. Surveys differ in timing, sample and method, so their numbers are not directly comparable.
| Pollster | Dates | Sample · population | Share who would vote for the candidate |
|---|---|---|---|
| Survey 1602026-10-27 – 2026-11-01 1,322 · likely voters | 2026-10-27 – 2026-11-01 | 1,322 · likely voters | Troy Jackson 50% Susan Collins 46% |
| The New York Times/Siena University2026-10-27 – 2026-11-01 714 · likely voters | 2026-10-27 – 2026-11-01 | 714 · likely voters | Troy Jackson 51% Susan Collins 45% |
| University of New Hampshire2026-10-27 – 2026-10-31 1,654 · likely voters | 2026-10-27 – 2026-10-31 | 1,654 · likely voters | Troy Jackson 54% Susan Collins 45% |
Now held by Janet Mills
Counting continues; the result may still change. Fetched 2026-11-16 02:14 UTC. civicAPI
Vote counts come from civicAPI, which gathers the counts published by state election offices; we transcribe them and do not tally.
The latest three surveys as each pollster published them; we show them as released and do not calculate, weight or average them. Percentages are the share of respondents who say they would vote for each candidate. Surveys differ in timing, sample and method, so their numbers are not directly comparable.
| Pollster | Dates | Sample · population | Share who would vote for the candidate |
|---|---|---|---|
| Survey 1602026-10-27 – 2026-11-01 1,322 · likely voters | 2026-10-27 – 2026-11-01 | 1,322 · likely voters | Hannah Pingree 53% Robert B. Charles 41% |
| The New York Times/Siena University2026-10-27 – 2026-11-01 714 · likely voters | 2026-10-27 – 2026-11-01 | 714 · likely voters | Hannah Pingree 49% Robert B. Charles 37% Rick Bennett 8% |
| University of New Hampshire2026-10-27 – 2026-10-31 1,654 · likely voters | 2026-10-27 – 2026-10-31 | 1,654 · likely voters | Hannah Pingree 51% Robert B. Charles 40% Rick Bennett 7% |
The state has 2 seats in the US House; its current members are 2 Democrats. Every seat is up for election on November 3.
Counting continues; the result may still change. Fetched 2026-11-16 02:14 UTC. civicAPI
| District | Candidates and votes |
|---|---|
| District 1 | Chellie Pingree (Democratic, leading) · 247,947 votes 66.1% Ronald Russell (Republican) · 127,098 votes 33.9% |
| District 2 | Paul LePage (Republican, leading) · 170,360 votes 50.8% Matthew Dunlap (Democratic) · 164,855 votes 49.2% Write-in · 165 votes 0.0% |
Vote counts come from civicAPI, which gathers the counts published by state election offices; we transcribe them and do not tally.
Now held by Gary C. Peters
Counting continues; the result may still change. Fetched 2026-11-16 02:14 UTC. civicAPI
Vote counts come from civicAPI, which gathers the counts published by state election offices; we transcribe them and do not tally.
The latest three surveys as each pollster published them; we show them as released and do not calculate, weight or average them. Percentages are the share of respondents who say they would vote for each candidate. Surveys differ in timing, sample and method, so their numbers are not directly comparable.
| Pollster | Dates | Sample · population | Share who would vote for the candidate |
|---|---|---|---|
| The New York Times/Siena University2026-10-23 – 2026-11-01 1,011 · likely voters | 2026-10-23 – 2026-11-01 | 1,011 · likely voters | Abdul El-Sayed 53% Mike Rogers 42% |
| YouGov2026-10-26 – 2026-10-29 2,093 · likely voters | 2026-10-26 – 2026-10-29 | 2,093 · likely voters | Abdul El-Sayed 51% Mike Rogers 47% |
| Upswing Researchpartisan poll (DEM) · for Demand Justice2026-10-24 – 2026-10-28 505 · likely voters | 2026-10-24 – 2026-10-28 | 505 · likely voters | Abdul El-Sayed 50% Mike Rogers 45% |
Now held by Gretchen Whitmer
Counting continues; the result may still change. Fetched 2026-11-16 02:14 UTC. civicAPI
Vote counts come from civicAPI, which gathers the counts published by state election offices; we transcribe them and do not tally.
The latest three surveys as each pollster published them; we show them as released and do not calculate, weight or average them. Percentages are the share of respondents who say they would vote for each candidate. Surveys differ in timing, sample and method, so their numbers are not directly comparable.
| Pollster | Dates | Sample · population | Share who would vote for the candidate |
|---|---|---|---|
| The New York Times/Siena University2026-10-23 – 2026-11-01 1,011 · likely voters | 2026-10-23 – 2026-11-01 | 1,011 · likely voters | Jocelyn Benson 52% John James 39% |
| YouGov2026-10-26 – 2026-10-29 2,093 · likely voters | 2026-10-26 – 2026-10-29 | 2,093 · likely voters | Jocelyn Benson 52% John James 46% |
| Mitchell Research & Communicationsfor WWJ-TV, WKBD-TV2026-10-26 – 2026-10-27 636 · likely voters | 2026-10-26 – 2026-10-27 | 636 · likely voters | Jocelyn Benson 49% John James 44% |
The state has 13 seats in the US House; its current members are 7 Republicans and 6 Democrats. Every seat is up for election on November 3.
Counting continues; the result may still change. Fetched 2026-11-16 02:14 UTC. civicAPI
| District | Candidates and votes |
|---|---|
| District 1 | Jack Bergman (Republican, leading) · 217,728 votes 53.8% Callie Barr (Democratic) · 179,076 votes 44.2% Arnett Satterla (Libertarian) · 2,765 votes 0.7% Liz Hakola (Working Class) · 2,391 votes 0.6% Doc Kovaly (U.S. Taxpayers) · 1,232 votes 0.3% Zebulon Featherly (No Party Affiliation) · 925 votes 0.2% LaVeta Davenport (Green) · 776 votes 0.2% Write-in · 57 votes 0.0% |
| District 2 | John Moolenaar (Republican, leading) · 220,406 votes 61.4% Benjamin Ambrose (Democratic) · 132,543 votes 36.9% Charlotte Magoon (Green) · 3,851 votes 1.1% Richard Sills (Natural Law) · 1,765 votes 0.5% Write-in · 177 votes 0.0% |
| District 3 | Hillary Scholten (Democratic, leading) · 212,868 votes 57.2% Terri DeBoer (Republican) · 153,724 votes 41.3% Joe Jock (Green) · 5,375 votes 1.4% Write-in · 461 votes 0.1% |
| District 4 | Sean McCann (Democratic, leading) · 186,238 votes 50.1% Bill Huizenga (Republican) · 179,505 votes 48.3% Shafina Che Barnett (Green) · 5,698 votes 1.5% Write-in · 313 votes 0.1% |
| District 5 | Tim Walberg (Republican, leading) · 199,526 votes 59.1% Christian Vukasovich (Democratic) · 130,093 votes 38.5% Ronald A Muszynski (Libertarian) · 3,463 votes 1.0% Sharon Marie Renier (U.S. Taxpayers) · 3,125 votes 0.9% Jim Bronke (Green) · 1,232 votes 0.4% Write-in · 156 votes 0.0% |
| District 6 | Debbie Dingell (Democratic, leading) · 262,933 votes 67.4% Heather Smiley (Republican) · 118,422 votes 30.3% Linda Rayburn (Working Class) · 2,830 votes 0.7% Timothy A. Teagan (Libertarian) · 2,689 votes 0.7% Clyde Shabazz (Green) · 2,105 votes 0.5% Mike Mickevicius (U.S. Taxpayers) · 1,019 votes 0.3% Write-in · 220 votes 0.1% Bree Arlene Taylor (Nonpartisan) · 0 votes 0.0% |
| District 7 | William Lawrence (Democratic, leading) · 202,672 votes 51.0% Tom Barrett (Republican) · 189,485 votes 47.7% Shane Dedrick (Green) · 4,974 votes 1.3% Write-in · 263 votes 0.1% |
| District 8 | Kristen McDonald Rivet (Democratic, leading) · 195,877 votes 55.5% Tom Smith (Republican) · 147,857 votes 41.9% Kathy Goodwin (Working Class) · 5,170 votes 1.5% C. Mia Pettus (Libertarian) · 2,857 votes 0.8% Jim Casha (Green) · 1,044 votes 0.3% Write-in · 119 votes 0.0% |
| District 9 | Lisa McClain (Republican, leading) · 247,817 votes 62.6% Ray Pooley (Democratic) · 137,276 votes 34.7% Jim Walkowicz (Working Class) · 4,088 votes 1.0% Kevin Vayko (Libertarian) · 3,455 votes 0.9% John Vlahos (U.S. Taxpayers) · 1,578 votes 0.4% Destiny Clayton (Green) · 1,377 votes 0.3% Write-in · 205 votes 0.1% |
| District 10 | Christina Hines (Democratic, leading) · 188,078 votes 52.4% Michael Bouchard Jr. (Republican) · 162,347 votes 45.2% Andrea L. Kirby (Working Class) · 3,978 votes 1.1% Mike Saliba (Libertarian) · 3,088 votes 0.9% Kwabena Nkromo (Green) · 1,174 votes 0.3% Write-in · 502 votes 0.1% |
| District 11 | Jeremy Moss (Democratic, leading) · 238,750 votes 60.9% Ethan Baker (Republican) · 144,529 votes 36.8% Anil Kumar (No Party Affiliation) · 3,174 votes 0.8% Farid Ishac (Libertarian) · 2,946 votes 0.8% Ryan Teasdale (Green) · 2,902 votes 0.7% |
| District 12 | Rashida Tlaib (Democratic, leading) · 247,185 votes 75.8% James Hooper (Republican) · 68,960 votes 21.2% Gary Walkowicz (Working Class) · 3,776 votes 1.2% Brenda K. Sanders (Green) · 3,365 votes 1.0% Marc Joseph Sosnowski (U.S. Taxpayers) · 2,036 votes 0.6% Write-in · 605 votes 0.2% |
| District 13 | Donavan McKinney (Democratic, leading) · 209,882 votes 76.3% T.P. Nykoriak (Republican) · 54,484 votes 19.8% Simone R. Coleman (Working Class) · 5,743 votes 2.1% Chris Dardzinski (U.S. Taxpayers) · 2,666 votes 1.0% Raelyn Light (Green) · 1,549 votes 0.6% Write-in · 868 votes 0.3% |
Vote counts come from civicAPI, which gathers the counts published by state election offices; we transcribe them and do not tally.
ABC NewsFox NewsABC NewsThe Associated PressNow held by Tina Smith
Counting continues; the result may still change. Fetched 2026-11-16 02:14 UTC. civicAPI
Vote counts come from civicAPI, which gathers the counts published by state election offices; we transcribe them and do not tally.
The latest three surveys as each pollster published them; we show them as released and do not calculate, weight or average them. Percentages are the share of respondents who say they would vote for each candidate. Surveys differ in timing, sample and method, so their numbers are not directly comparable.
| Pollster | Dates | Sample · population | Share who would vote for the candidate |
|---|---|---|---|
| AtlasIntel2026-10-28 – 2026-11-01 2,133 · likely voters | 2026-10-28 – 2026-11-01 | 2,133 · likely voters | Peggy Flanagan 48% Michele Tafoya 46% |
| Quantus Insights2026-09-08 – 2026-09-10 720 · likely voters | 2026-09-08 – 2026-09-10 | 720 · likely voters | Peggy Flanagan 48.2% Michele Tafoya 44.4% |
| Emerson College2026-02-06 – 2026-02-08 1,000 · likely voters | 2026-02-06 – 2026-02-08 | 1,000 · likely voters | Peggy Flanagan 47.1% Michele Tafoya 40.6% |
Now held by Tim Walz
Counting continues; the result may still change. Fetched 2026-11-16 02:14 UTC. civicAPI
Vote counts come from civicAPI, which gathers the counts published by state election offices; we transcribe them and do not tally.
The latest three surveys as each pollster published them; we show them as released and do not calculate, weight or average them. Percentages are the share of respondents who say they would vote for each candidate. Surveys differ in timing, sample and method, so their numbers are not directly comparable.
| Pollster | Dates | Sample · population | Share who would vote for the candidate |
|---|---|---|---|
| Survey 1602026-10-27 – 2026-11-01 1,365 · likely voters | 2026-10-27 – 2026-11-01 | 1,365 · likely voters | Amy Klobuchar 53% Lisa Demuth 42% |
| Mason-Dixonfor StarTribune, KARE2026-10-05 – 2026-10-07 800 · likely voters | 2026-10-05 – 2026-10-07 | 800 · likely voters | Amy Klobuchar 50% Lisa Demuth 41% |
| SurveyUSAfor KSTP-TV2026-01-27 – 2026-01-30 575 · registered voters | 2026-01-27 – 2026-01-30 | 575 · registered voters | Amy Klobuchar 49% Lisa Demuth 34% |
The state has 8 seats in the US House; its current members are 4 Democrats and 4 Republicans. Every seat is up for election on November 3.
Counting continues; the result may still change. Fetched 2026-11-16 02:14 UTC. civicAPI
| District | Candidates and votes |
|---|---|
| District 1 | Jake Johnson (Democratic, leading) · 163,055 votes 50.0% Brad Finstad (Republican) · 162,733 votes 49.9% Write-in · 391 votes 0.1% |
| District 2 | Matt Little (Democratic, leading) · 214,282 votes 57.1% Eric Pratt (Republican) · 160,645 votes 42.8% Write-in · 314 votes 0.1% |
| District 3 | Kelly Morrison (Democratic, leading) · 242,079 votes 64.0% Tyler Bass (Republican) · 135,504 votes 35.8% Write-in · 413 votes 0.1% |
| District 4 | Betty McCollum (Democratic, leading) · 245,699 votes 73.1% Paul Wikstrom (Republican) · 90,067 votes 26.8% Write-in · 477 votes 0.1% |
| District 5 | Ilhan Omar (Democratic, leading) · 263,496 votes 76.5% John Nagel (Republican) · 55,851 votes 16.2% DeVelle L. Jackson (Independent) · 24,236 votes 7.0% Write-in · 934 votes 0.3% |
| District 6 | Tom Emmer (Republican, leading) · 204,702 votes 55.7% Doug Chapin (Democratic) · 162,212 votes 44.2% Write-in · 427 votes 0.1% |
| District 7 | Michelle Fischbach (Republican, leading) · 214,677 votes 64.9% Erik Osberg (Democratic) · 115,859 votes 35.0% Write-in · 322 votes 0.1% |
| District 8 | Pete Stauber (Republican, leading) · 190,667 votes 53.0% Trina Swanson (Democratic) · 168,427 votes 46.9% Write-in · 359 votes 0.1% |
Vote counts come from civicAPI, which gathers the counts published by state election offices; we transcribe them and do not tally.
No official results for this state yet. Official state results page
Now held by Mike Kehoe
No official results for this state yet. Official state results page
The state has 8 seats in the US House; its current members are 6 Republicans and 2 Democrats. Every seat is up for election on November 3.
Counting continues; the result may still change. Fetched 2026-11-16 02:14 UTC. civicAPI
| District | Candidates and votes |
|---|---|
| District 1 | Wesley Bell (Democratic, leading) · 189,175 votes 81.5% Paul Berry (Republican) · 32,362 votes 13.9% Tom Schmitz (Libertarian) · 10,613 votes 4.6% |
| District 2 | Fred Wellman (Democratic, leading) · 169,477 votes 51.1% Ann Wagner (Republican) · 153,132 votes 46.2% Brandon Coulter Daugherty (Libertarian) · 8,782 votes 2.7% |
| District 3 | Bob Onder (Republican, leading) · 149,268 votes 52.9% Bethany Mann (Democratic) · 125,284 votes 44.4% Jim Higgins (Libertarian) · 7,702 votes 2.7% |
| District 4 | Mark Alford (Republican, leading) · 154,256 votes 61.5% Jordan Herrera (Democratic) · 89,196 votes 35.6% Thomas Holbrook (Libertarian) · 7,290 votes 2.9% |
| District 5 | Emanuel Cleaver (Democratic, leading) · 179,256 votes 69.5% Rick Brattin (Republican) · 72,572 votes 28.1% Randall (Randy) Langkraehr (Libertarian) · 6,128 votes 2.4% |
| District 6 | Chris Stigall (Republican, leading) · 151,374 votes 58.7% Josh Smead (Democratic) · 100,460 votes 39.0% Andy Maidment (Libertarian) · 6,031 votes 2.3% |
| District 7 | Eric Burlison (Republican, leading) · 158,413 votes 62.2% Missi Hesketh (Democratic) · 90,186 votes 35.4% Kevin Craig (Libertarian) · 6,141 votes 2.4% |
| District 8 | Jason Smith (Republican, leading) · 152,685 votes 67.7% Christopher Reichard (Democratic) · 65,754 votes 29.2% Rebecca Sharpe Lombard (Libertarian) · 6,997 votes 3.1% |
Vote counts come from civicAPI, which gathers the counts published by state election offices; we transcribe them and do not tally.
Now held by Cindy Hyde-Smith
Counting continues; the result may still change. Fetched 2026-11-16 02:14 UTC. civicAPI
Vote counts come from civicAPI, which gathers the counts published by state election offices; we transcribe them and do not tally.
The latest three surveys as each pollster published them; we show them as released and do not calculate, weight or average them. Percentages are the share of respondents who say they would vote for each candidate. Surveys differ in timing, sample and method, so their numbers are not directly comparable.
| Pollster | Dates | Sample · population | Share who would vote for the candidate |
|---|---|---|---|
| Wedgewood Polls2026-10-12 – 2026-10-14 511 · likely voters | 2026-10-12 – 2026-10-14 | 511 · likely voters | Cindy Hyde-Smith 52% Scott Colom 48% |
| Data for Progresspartisan poll (DEM) · for Way to Lead PAC2026-08-05 – 2026-08-15 1,018 · likely voters | 2026-08-05 – 2026-08-15 | 1,018 · likely voters | Cindy Hyde-Smith 47% Scott Colom 41% |
| Impact Researchpartisan poll (DEM) · for SPLC Action Fund2026-04-08 – 2026-04-12 500 · likely voters | 2026-04-08 – 2026-04-12 | 500 · likely voters | Scott Colom 44% Cindy Hyde-Smith 47% |
Now held by Tate Reeves
No official results for this state yet.
The state has 4 seats in the US House; its current members are 3 Republicans and 1 Democrat. Every seat is up for election on November 3.
Counting continues; the result may still change. Fetched 2026-11-16 02:14 UTC. civicAPI
| District | Candidates and votes |
|---|---|
| District 1 | Trent Kelly (Republican, leading) · 141,401 votes 58.0% Cliff Johnson (Democratic) · 99,147 votes 40.6% Johnny Baucom (Libertarian) · 3,390 votes 1.4% |
| District 2 | Bennie Thompson (Democratic, leading) · 168,760 votes 67.9% Ron Eller (Republican) · 73,898 votes 29.7% Bennie Foster (Independent) · 5,998 votes 2.4% |
| District 3 | Michael Guest (Republican, leading) · 147,004 votes 57.3% Michael Chiaradio (Democratic) · 106,206 votes 41.4% Erik Kiehle (Libertarian) · 3,218 votes 1.3% |
| District 4 | Mike Ezell (Republican, leading) · 133,614 votes 60.8% Jeffrey Hulum (Democratic) · 79,367 votes 36.1% Carl Boyanton (Independent) · 6,726 votes 3.1% |
Vote counts come from civicAPI, which gathers the counts published by state election offices; we transcribe them and do not tally.
NBC NewsNBC NewsNBC NewsNBC NewsNow held by Steve Daines
Counting continues; the result may still change. Fetched 2026-11-16 02:14 UTC. civicAPI
Vote counts come from civicAPI, which gathers the counts published by state election offices; we transcribe them and do not tally.
The latest three surveys as each pollster published them; we show them as released and do not calculate, weight or average them. Percentages are the share of respondents who say they would vote for each candidate. Surveys differ in timing, sample and method, so their numbers are not directly comparable.
| Pollster | Dates | Sample · population | Share who would vote for the candidate |
|---|---|---|---|
| Concord Public Opinion Partnerspartisan poll (DEM) · for Democrats for Education Reform2026-10-22 – 2026-10-23 410 · likely voters | 2026-10-22 – 2026-10-23 | 410 · likely voters | Kurt Alme 38% Alani Bankhead 10% Seth Bodnar 39% Kyle Austin 2% |
| Montana State University Billings2026-10-05 – 2026-10-21 720 · adults | 2026-10-05 – 2026-10-21 | 720 · adults | Kurt Alme 30% Alani Bankhead 26% Seth Bodnar 21% Kyle Austin 3% |
| Quantus Insights2026-10-15 – 2026-10-18 686 · likely voters | 2026-10-15 – 2026-10-18 | 686 · likely voters | Kurt Alme 46% Alani Bankhead 29% Seth Bodnar 21% Kyle Austin 2% |
Now held by Greg Gianforte
No official results for this state yet.
The state has 2 seats in the US House; its current members are 2 Republicans. Every seat is up for election on November 3.
Counting continues; the result may still change. Fetched 2026-11-16 02:14 UTC. civicAPI
| District | Candidates and votes |
|---|---|
| District 1 | Sam Forstag (Democratic, leading) · 135,096 votes 50.5% Aaron Flint (Republican) · 124,747 votes 46.6% Nick Sheedy (Libertarian) · 7,719 votes 2.9% |
| District 2 | Troy Downing (Republican, leading) · 128,186 votes 58.1% Brian Miller (Democratic) · 71,179 votes 32.3% Michael Eisenhauer (Independent) · 17,199 votes 7.8% Patrick McCracken (Libertarian) · 4,046 votes 1.8% |
Vote counts come from civicAPI, which gathers the counts published by state election offices; we transcribe them and do not tally.
No related reports for this state yet.
Now held by Thom Tillis
2626 of 2626 precincts have reported results (all). The result is not yet certified and may still change. Official count as of 2026-11-13 23:03 UTC. Official state results page
“Reported” counts the units that have sent in results; it is not the share of votes counted. Most states release early and mail ballots first, in batches, and mail ballots may still be counted after Election Day.
Vote counts are transcribed from each state’s official results page; we do not tally them.
The latest three surveys as each pollster published them; we show them as released and do not calculate, weight or average them. Percentages are the share of respondents who say they would vote for each candidate. Surveys differ in timing, sample and method, so their numbers are not directly comparable.
| Pollster | Dates | Sample · population | Share who would vote for the candidate |
|---|---|---|---|
| AtlasIntel2026-10-28 – 2026-11-01 1,459 · likely voters | 2026-10-28 – 2026-11-01 | 1,459 · likely voters | Roy Cooper 56.4% Michael Whatley 41.5% |
| East Carolina University2026-10-26 – 2026-10-29 1,041 · likely voters | 2026-10-26 – 2026-10-29 | 1,041 · likely voters | Roy Cooper 54% Michael Whatley 45% Shannon Bray 1% Michael Dublin 0% |
| Quantus Insights2026-10-24 – 2026-10-25 722 · likely voters | 2026-10-24 – 2026-10-25 | 722 · likely voters | Roy Cooper 51.4% Michael Whatley 42.8% Shannon Bray 1.3% Michael Dublin 0.7% |
Now held by Josh Stein
No official results for this state yet. Official state results page
The state has 14 seats in the US House; its current members are 10 Republicans and 4 Democrats. Every seat is up for election on November 3.
Counting continues; the result may still change. Fetched 2026-11-16 02:14 UTC. civicAPI
| District | Candidates and votes |
|---|---|
| District 1 | Don Davis (Democratic, leading) · 157,490 votes 50.1% Laurie Buckhout (Republican) · 146,696 votes 46.7% Tom Bailey (Libertarian) · 9,944 votes 3.2% |
| District 2 | Deborah Ross (Democratic, leading) · 246,446 votes 75.1% Gene Douglass (Republican) · 76,976 votes 23.4% Matt Laszacs (Libertarian) · 4,299 votes 1.3% Brian McGinnis (Write-In) · 270 votes 0.1% Write-In · 265 votes 0.1% |
| District 3 | Raymond Smith Jr. (Democratic, leading) · 118,434 votes 49.4% Greg Murphy (Republican) · 118,176 votes 49.3% Daniel Cavender (Libertarian) · 3,004 votes 1.3% |
| District 4 | Valerie Foushee (Democratic, leading) · 284,548 votes 79.1% Max Ganorkar (Republican) · 68,019 votes 18.9% Guy Meilleur (Libertarian) · 7,004 votes 1.9% |
| District 5 | Chuck Hubbard (Democratic, leading) · 139,770 votes 48.7% Virginia Foxx (Republican) · 139,439 votes 48.6% Robert Luffman (Libertarian) · 7,579 votes 2.6% |
| District 6 | Cyril Jefferson (Democratic, leading) · 140,707 votes 51.2% Addison McDowell (Republican) · 134,103 votes 48.8% |
| District 7 | David Rouzer (Republican, leading) · 160,702 votes 49.9% Kim Hardy (Democratic) · 158,391 votes 49.1% Maad Abu-Ghazalah (Libertarian) · 3,173 votes 1.0% |
| District 8 | Mark Harris (Republican, leading) · 147,683 votes 50.4% Colby Watson (Democratic) · 142,659 votes 48.6% Bo Whitehead (Green) · 2,909 votes 1.0% |
| District 9 | Richard Ojeda (Democratic, leading) · 139,456 votes 51.1% Richard Hudson (Republican) · 133,196 votes 48.9% |
| District 10 | Pat Harrigan (Republican, leading) · 146,590 votes 49.6% Ashley Bell (Democratic) · 144,081 votes 48.8% Steve Feldman (Libertarian) · 4,710 votes 1.6% |
| District 11 | Jamie Ager (Democratic, leading) · 196,251 votes 57.1% Jennifer Balkcom (Republican) · 141,885 votes 41.3% Travis Groo (Libertarian) · 5,369 votes 1.6% |
| District 12 | Alma Adams (Democratic, leading) · 220,770 votes 81.2% Jack Codiga (Republican) · 51,022 votes 18.8% |
| District 13 | Paul Barringer (Democratic, leading) · 160,860 votes 50.5% Brad Knott (Republican) · 152,864 votes 48.0% Steven Swinton (Libertarian) · 4,511 votes 1.4% |
| District 14 | Lakesha Womack (Democratic, leading) · 147,920 votes 51.1% Tim Moore (Republican) · 141,353 votes 48.9% |
Vote counts come from civicAPI, which gathers the counts published by state election offices; we transcribe them and do not tally.
NBC NewsNBC NewsNBC NewsNo official results for this state yet.
Now held by Kelly Armstrong
No official results for this state yet.
The state has 1 seats in the US House; its current members are 1 Republican. Every seat is up for election on November 3.
Counting continues; the result may still change. Fetched 2026-11-16 02:14 UTC. civicAPI
| District | Candidates and votes |
|---|---|
| At-large | Julie Fedorchak (Republican, leading) · 134,477 votes 57.3% Trygve Hammer (Democratic) · 85,892 votes 36.6% Charles Tuttle (Independent) · 9,282 votes 4.0% Helene Neville (Independent) · 4,604 votes 2.0% Write-in · 340 votes 0.1% |
Vote counts come from civicAPI, which gathers the counts published by state election offices; we transcribe them and do not tally.
No related reports for this state yet.
Now held by Pete Ricketts
1322 of 1322 precincts have reported results (all). The result is not yet certified and may still change. Official count as of 2026-11-15 02:13 UTC. Official state results page
“Reported” counts the units that have sent in results; it is not the share of votes counted. Most states release early and mail ballots first, in batches, and mail ballots may still be counted after Election Day.
Vote counts are transcribed from each state’s official results page; we do not tally them.
The latest three surveys as each pollster published them; we show them as released and do not calculate, weight or average them. Percentages are the share of respondents who say they would vote for each candidate. Surveys differ in timing, sample and method, so their numbers are not directly comparable.
| Pollster | Dates | Sample · population | Share who would vote for the candidate |
|---|---|---|---|
| Echelon Insightsfor NetChoice2026-10-16 – 2026-10-23 407 · likely voters | 2026-10-16 – 2026-10-23 | 407 · likely voters | Pete Ricketts 47% Dan Osborn 46% Robin Richards 2% Chuck Conboy 1% |
| National Public Affairs2026-10-15 – 2026-10-18 598 · likely voters | 2026-10-15 – 2026-10-18 | 598 · likely voters | Pete Ricketts 50% Dan Osborn 47% |
| National Public Affairs2026-10-02 – 2026-10-05 800 · likely voters | 2026-10-02 – 2026-10-05 | 800 · likely voters | Pete Ricketts 49% Dan Osborn 46% |
Now held by Jim Pillen
1322 of 1322 precincts have reported results (all). The result is not yet certified and may still change. Official count as of 2026-11-15 02:13 UTC. Official state results page
“Reported” counts the units that have sent in results; it is not the share of votes counted. Most states release early and mail ballots first, in batches, and mail ballots may still be counted after Election Day.
Vote counts are transcribed from each state’s official results page; we do not tally them.
The latest three surveys as each pollster published them; we show them as released and do not calculate, weight or average them. Percentages are the share of respondents who say they would vote for each candidate. Surveys differ in timing, sample and method, so their numbers are not directly comparable.
| Pollster | Dates | Sample · population | Share who would vote for the candidate |
|---|---|---|---|
| YouGov2026-10-26 – 2026-10-29 1,979 · likely voters | 2026-10-26 – 2026-10-29 | 1,979 · likely voters | Jim Pillen 50% Lynne Walz 47% |
| Echelon Insightsfor NetChoice2026-10-16 – 2026-10-23 407 · likely voters | 2026-10-16 – 2026-10-23 | 407 · likely voters | Jim Pillen 47% Lynne Walz 40% Brett Lindstrom 4% Rick Beard 7% |
| National Public Affairs2026-10-15 – 2026-10-18 598 · likely voters | 2026-10-15 – 2026-10-18 | 598 · likely voters | Jim Pillen 47% Lynne Walz 41% Brett Lindstrom 5% Rick Beard 3% |
The state has 3 seats in the US House; its current members are 3 Republicans. Every seat is up for election on November 3.
Counting continues; the result may still change. Fetched 2026-11-16 02:14 UTC. civicAPI
| District | Candidates and votes |
|---|---|
| District 1 | Mike Flood (Republican, leading) · 128,772 votes 49.6% Chris Backemeyer (Democratic) · 121,340 votes 46.8% Nik Sandman (Libertarian) · 4,739 votes 1.8% Dan Hartong (America First) · 4,509 votes 1.7% |
| District 2 | Denise Powell (Democratic, leading) · 145,503 votes 56.7% Brinker Harding (Republican) · 104,611 votes 40.7% Eric Michael Foreman (Libertarian) · 6,686 votes 2.6% |
| District 3 | Adrian Smith (Republican, leading) · 174,289 votes 71.0% Becky Stille (Democratic) · 49,066 votes 20.0% Mark Cohen (Independent) · 8,109 votes 3.3% David Else (Legal Marijuana Now) · 7,140 votes 2.9% Macey Budke (Nebraska Working People) · 6,876 votes 2.8% |
Vote counts come from civicAPI, which gathers the counts published by state election offices; we transcribe them and do not tally.
No related reports for this state yet.
Now held by Jeanne Shaheen
Counting continues; the result may still change. Fetched 2026-11-16 02:14 UTC. civicAPI
Vote counts come from civicAPI, which gathers the counts published by state election offices; we transcribe them and do not tally.
The latest three surveys as each pollster published them; we show them as released and do not calculate, weight or average them. Percentages are the share of respondents who say they would vote for each candidate. Surveys differ in timing, sample and method, so their numbers are not directly comparable.
| Pollster | Dates | Sample · population | Share who would vote for the candidate |
|---|---|---|---|
| University of New Hampshire2026-10-27 – 2026-10-31 2,040 · likely voters | 2026-10-27 – 2026-10-31 | 2,040 · likely voters | Chris Pappas 54% John E. Sununu 42% Edmond LaPlante 2% |
| National Public Affairspartisan poll (REP) · for God Family & Country PAC2026-10-25 – 2026-10-29 800 · likely voters | 2026-10-25 – 2026-10-29 | 800 · likely voters | Chris Pappas 51% John E. Sununu 45% Edmond LaPlante 2% |
| Saint Anselm2026-10-19 – 2026-10-20 1,672 · likely voters | 2026-10-19 – 2026-10-20 | 1,672 · likely voters | Chris Pappas 50% John E. Sununu 43% |
Now held by Kelly Ayotte
Counting continues; the result may still change. Fetched 2026-11-16 02:14 UTC. civicAPI
Vote counts come from civicAPI, which gathers the counts published by state election offices; we transcribe them and do not tally.
The latest three surveys as each pollster published them; we show them as released and do not calculate, weight or average them. Percentages are the share of respondents who say they would vote for each candidate. Surveys differ in timing, sample and method, so their numbers are not directly comparable.
| Pollster | Dates | Sample · population | Share who would vote for the candidate |
|---|---|---|---|
| Saint Anselm2026-10-19 – 2026-10-20 1,672 · likely voters | 2026-10-19 – 2026-10-20 | 1,672 · likely voters | Kelly Ayotte 50% Cinde Warmington 42% |
| The New York Times/Siena University2026-09-15 – 2026-09-22 613 · likely voters | 2026-09-15 – 2026-09-22 | 613 · likely voters | Kelly Ayotte 52% Cinde Warmington 41% |
| co/efficient2026-09-09 – 2026-09-11 958 · likely voters | 2026-09-09 – 2026-09-11 | 958 · likely voters | Kelly Ayotte 55% Cinde Warmington 34% |
The state has 2 seats in the US House; its current members are 2 Democrats. Every seat is up for election on November 3.
Counting continues; the result may still change. Fetched 2026-11-16 02:14 UTC. civicAPI
| District | Candidates and votes |
|---|---|
| District 1 | Stefany Shaheen (Democratic, leading) · 180,683 votes 57.0% Anthony DiLorenzo (Republican) · 136,041 votes 42.9% Write-in · 508 votes 0.2% |
| District 2 | Maggie Goodlander (Democratic, leading) · 187,657 votes 59.0% Lily Tang Williams (Republican) · 122,645 votes 38.6% Robbie Mahrou (Independent) · 7,478 votes 2.4% Write-in · 234 votes 0.1% |
Vote counts come from civicAPI, which gathers the counts published by state election offices; we transcribe them and do not tally.
No related reports for this state yet.
Now held by Cory A. Booker
Counting continues; the result may still change. Fetched 2026-11-16 02:14 UTC. civicAPI
Vote counts come from civicAPI, which gathers the counts published by state election offices; we transcribe them and do not tally.
Now held by Mikie Sherrill
No official results for this state yet.
The state has 12 seats in the US House; its current members are 9 Democrats and 3 Republicans. Every seat is up for election on November 3.
Counting continues; the result may still change. Fetched 2026-11-16 02:14 UTC. civicAPI
| District | Candidates and votes |
|---|---|
| District 1 | Donald Norcross (Democratic, leading) · 181,836 votes 70.3% Damon Galdo (Republican) · 76,463 votes 29.6% Write-in · 271 votes 0.1% Robin Brownfield (Write-In) · 3 votes 0.0% Carole Roskoph (Write-In) · 2 votes 0.0% Brian K Everett (Write-In) · 1 votes 0.0% Jesus (Write-In) · 1 votes 0.0% Larry Merrill (Write-In) · 1 votes 0.0% Lee Widman (Write-In) · 1 votes 0.0% Lynn Sarsillo (Write-In) · 1 votes 0.0% Simon (Write-In) · 1 votes 0.0% Theodore Plush Do (Write-In) · 1 votes 0.0% |
| District 2 | Zack Mullock (Democratic, leading) · 137,722 votes 50.8% Jeff Van Drew (Republican) · 130,305 votes 48.1% Ramon Mora Jr. (Independent) · 2,841 votes 1.0% Write-in · 103 votes 0.0% Tim Alexander (Independent) · 2 votes 0.0% Andres Jinete (Independent) · 1 votes 0.0% Jenna Weber (Independent) · 1 votes 0.0% Joe Kent (Independent) · 1 votes 0.0% Layla Narzikulov (Independent) · 1 votes 0.0% |
| District 3 | Herb Conaway (Democratic, leading) · 173,675 votes 62.7% Michael McGuire (Republican) · 97,630 votes 35.3% Ryan Michael Kelly (Independent) · 3,687 votes 1.3% Steven Welzer (Green) · 1,722 votes 0.6% Write-in · 190 votes 0.1% Jason Cullen (Write-In) · 16 votes 0.0% Thomas Massie (Write-In) · 3 votes 0.0% Aaron Mitchell (Write-In) · 2 votes 0.0% Fred A. Hartley Jr. (Write-In) · 2 votes 0.0% No One (Write-In) · 2 votes 0.0% None of the Above (Write-In) · 2 votes 0.0% Gary Stout (Write-In) · 1 votes 0.0% |
| District 4 | Chris Smith (Republican, leading) · 157,739 votes 58.9% Rachel Peace (Democratic) · 109,668 votes 41.0% Write-in · 327 votes 0.1% |
| District 5 | Josh Gottheimer (Democratic, leading) · 170,168 votes 62.5% Sean Kirrane (Republican) · 94,149 votes 34.6% Adam Rueda (Independent) · 8,120 votes 3.0% Write-in · 23 votes 0.0% |
| District 6 | Frank Pallone (Democratic, leading) · 148,155 votes 69.1% Hillary Herzig (Republican) · 65,247 votes 30.4% Write-in · 898 votes 0.4% |
| District 7 | Rebecca Bennett (Democratic, leading) · 192,270 votes 57.4% Thomas Kean Jr. (Republican) · 137,128 votes 41.0% Seamus Patrick O'Toole (Independent) · 5,184 votes 1.5% Write-in · 209 votes 0.1% |
| District 8 | Rob Menendez (Democratic, leading) · 112,079 votes 88.0% Craig Honts (Socialist Workers) · 5,406 votes 4.2% Aristotle Eliopoulos (Independent) · 5,350 votes 4.2% Da'Shone Hughey (Independent) · 3,708 votes 2.9% Write-in · 833 votes 0.7% |
| District 9 | Nellie Pou (Democratic, leading) · 123,779 votes 66.7% Rosie Pino (Republican) · 58,909 votes 31.7% Terrisa Bukovinac (Independent) · 2,714 votes 1.5% Write-in · 249 votes 0.1% |
| District 10 | LaMonica McIver (Democratic, leading) · 154,299 votes 84.6% Carmen Bucco (Republican) · 28,007 votes 15.4% Write-in · 92 votes 0.1% |
| District 11 | Analilia Mejia (Democratic, leading) · 170,498 votes 60.7% Joe Hathaway (Republican) · 107,369 votes 38.2% Alan B. Bond (Independent) · 2,513 votes 0.9% Write-in · 369 votes 0.1% |
| District 12 | Adam Hamawy (Democratic, leading) · 168,166 votes 70.4% Gregg Mele (Republican) · 66,417 votes 27.8% Winston Jordan (Independent) · 1,865 votes 0.8% Andres Jinete (Green) · 1,738 votes 0.7% Write-in · 636 votes 0.3% |
Vote counts come from civicAPI, which gathers the counts published by state election offices; we transcribe them and do not tally.
Now held by Ben Ray Luján
Counting continues; the result may still change. Fetched 2026-11-16 02:14 UTC. civicAPI
Vote counts come from civicAPI, which gathers the counts published by state election offices; we transcribe them and do not tally.
The latest three surveys as each pollster published them; we show them as released and do not calculate, weight or average them. Percentages are the share of respondents who say they would vote for each candidate. Surveys differ in timing, sample and method, so their numbers are not directly comparable.
| Pollster | Dates | Sample · population | Share who would vote for the candidate |
|---|---|---|---|
| SurveyUSAfor KOB-TV (Albuquerque)2026-09-25 – 2026-09-30 576 · likely voters | 2026-09-25 – 2026-09-30 | 576 · likely voters | Ben Ray Luján 54% Larry Marker 36% |
| Research & Polling Inc.for Albuquerque Journal2026-08-21 – 2026-08-28 516 · likely voters | 2026-08-21 – 2026-08-28 | 516 · likely voters | Ben Ray Luján 53% Larry Marker 38% |
Now held by Michelle Lujan Grisham
Counting continues; the result may still change. Fetched 2026-11-16 02:14 UTC. civicAPI
Vote counts come from civicAPI, which gathers the counts published by state election offices; we transcribe them and do not tally.
The latest three surveys as each pollster published them; we show them as released and do not calculate, weight or average them. Percentages are the share of respondents who say they would vote for each candidate. Surveys differ in timing, sample and method, so their numbers are not directly comparable.
| Pollster | Dates | Sample · population | Share who would vote for the candidate |
|---|---|---|---|
| BSP Research2026-07-22 – 2026-08-07 800 · registered voters | 2026-07-22 – 2026-08-07 | 800 · registered voters | Deb Haaland 41% Gregg Hull 24% |
The state has 3 seats in the US House; its current members are 3 Democrats. Every seat is up for election on November 3.
Counting continues; the result may still change. Fetched 2026-11-16 02:14 UTC. civicAPI
| District | Candidates and votes |
|---|---|
| District 1 | Melanie Stansbury (Democratic, leading) · 179,858 votes 63.6% Didi Okpareke (Republican) · 102,778 votes 36.4% |
| District 2 | Gabe Vasquez (Democratic, leading) · 123,753 votes 58.8% Greg Cunningham (Republican) · 86,875 votes 41.2% |
| District 3 | Teresa Leger Fernandez (Democratic, leading) · 141,444 votes 61.7% Martin Zamora (Republican) · 87,964 votes 38.3% |
Vote counts come from civicAPI, which gathers the counts published by state election offices; we transcribe them and do not tally.
No official results for this state yet. Official state results page
Now held by Joe Lombardo
Counting continues; the result may still change. Fetched 2026-11-16 02:14 UTC. civicAPI
Vote counts come from civicAPI, which gathers the counts published by state election offices; we transcribe them and do not tally.
The latest three surveys as each pollster published them; we show them as released and do not calculate, weight or average them. Percentages are the share of respondents who say they would vote for each candidate. Surveys differ in timing, sample and method, so their numbers are not directly comparable.
| Pollster | Dates | Sample · population | Share who would vote for the candidate |
|---|---|---|---|
| Hart Research Associatesfor A More Affordable Nevada2026-10-20 – 2026-10-25 950 · likely voters | 2026-10-20 – 2026-10-25 | 950 · likely voters | Joe Lombardo 45% Danielle Ford 49% |
| Noble Predictive Insights2026-09-22 – 2026-09-26 800 · registered voters | 2026-09-22 – 2026-09-26 | 800 · registered voters | Joe Lombardo 38% Danielle Ford 37% Danielle Ford 7% |
| Emerson Collegefor KLAS-TV2026-09-05 – 2026-09-08 680 · likely voters | 2026-09-05 – 2026-09-08 | 680 · likely voters | Joe Lombardo 42% Danielle Ford 44.2% Danielle Ford 2.4% |
The state has 4 seats in the US House; its current members are 3 Democrats and 1 Republican. Every seat is up for election on November 3.
Counting continues; the result may still change. Fetched 2026-11-16 02:14 UTC. civicAPI
| District | Candidates and votes |
|---|---|
| District 1 | Dina Titus (Democratic, leading) · 140,944 votes 59.2% Carrie Buck (Republican) · 89,724 votes 37.7% Steven "Chap" St John (No Political Party) · 4,116 votes 1.7% Afzal "Bobby" Khan (No Political Party) · 3,261 votes 1.4% |
| District 2 | Teresa Benitez-Thompson (Democratic, leading) · 161,624 votes 50.2% Dave Flippo (Republican) · 142,761 votes 44.3% Lynn Chapman (Independent American) · 17,636 votes 5.5% |
| District 3 | Susie Lee (Democratic, leading) · 161,418 votes 59.6% Martin O'Donnell (Republican) · 103,197 votes 38.1% Jon Kamerath (Independent American) · 6,345 votes 2.3% |
| District 4 | Steven Horsford (Democratic, leading) · 152,281 votes 60.4% Cody Whipple (Republican) · 95,097 votes 37.7% Russell Best (Independent American) · 2,544 votes 1.0% William Johnson (No Political Party) · 2,280 votes 0.9% |
Vote counts come from civicAPI, which gathers the counts published by state election offices; we transcribe them and do not tally.
No official results for this state yet.
Now held by Kathy Hochul
Counting continues; the result may still change. Fetched 2026-11-16 02:14 UTC. civicAPI
Vote counts come from civicAPI, which gathers the counts published by state election offices; we transcribe them and do not tally.
The latest three surveys as each pollster published them; we show them as released and do not calculate, weight or average them. Percentages are the share of respondents who say they would vote for each candidate. Surveys differ in timing, sample and method, so their numbers are not directly comparable.
| Pollster | Dates | Sample · population | Share who would vote for the candidate |
|---|---|---|---|
| Quinnipiac University2026-10-15 – 2026-10-19 1,167 · likely voters | 2026-10-15 – 2026-10-19 | 1,167 · likely voters | Kathy Hochul 55% Bruce Blakeman 41% |
| Beacon Researchfor Secure AI Project2026-10-01 – 2026-10-06 820 · registered voters | 2026-10-01 – 2026-10-06 | 820 · registered voters | Kathy Hochul 53% Bruce Blakeman 31% |
| Emerson Collegefor WPIX2026-10-03 – 2026-10-05 900 · likely voters | 2026-10-03 – 2026-10-05 | 900 · likely voters | Bruce Blakeman 39.7% Kathy Hochul 52.4% |
The state has 26 seats in the US House; its current members are 19 Democrats and 7 Republicans. Every seat is up for election on November 3.
Counting continues; the result may still change. Fetched 2026-11-16 02:14 UTC. civicAPI
| District | Candidates and votes |
|---|---|
| District 1 | Nick LaLota (Republican, leading) · 152,546 votes 51.1% Chris Gallant (Democratic) · 145,869 votes 48.9% Write-in · 170 votes 0.1% |
| District 2 | Andrew Garbarino (Republican, leading) · 124,271 votes 51.1% Patrick Halpin (Democratic) · 118,680 votes 48.8% Write-in · 201 votes 0.1% |
| District 3 | Tom Suozzi (Democratic, leading) · 141,870 votes 55.0% Mike LiPetri (Republican) · 115,330 votes 44.7% Write-in · 696 votes 0.3% |
| District 4 | Laura Gillen (Democratic, leading) · 146,755 votes 56.6% Jeanine Driscoll (Republican) · 111,878 votes 43.1% Blay Tarnoff (Libertarian) · 637 votes 0.2% Write-in · 234 votes 0.1% |
| District 5 | Gregory Meeks (Democratic, leading) · 129,931 votes 80.5% George Marsh (Republican) · 31,082 votes 19.3% Write-in · 405 votes 0.3% |
| District 6 | Grace Meng (Democratic, leading) · 92,474 votes 68.6% Joseph Chou (Republican) · 41,225 votes 30.6% Write-in · 1,050 votes 0.8% |
| District 7 | Claire Valdez (Democratic, leading) · 135,179 votes 83.3% Melvin Rivera (Republican) · 24,370 votes 15.0% Priscilla Ghaznavi (Independent) · 2,155 votes 1.3% Write-in · 514 votes 0.3% |
| District 8 | Hakeem Jeffries (Democratic, leading) · 128,197 votes 78.9% Lewis Mizrahi (Republican) · 31,969 votes 19.7% Write-in · 2,238 votes 1.4% |
| District 9 | Yvette Clarke (Democratic, leading) · 146,503 votes 82.1% Joel Anabilah-Azumah (Republican) · 30,378 votes 17.0% Write-in · 1,584 votes 0.9% |
| District 10 | Brad Lander (Democratic, leading) · 167,343 votes 83.2% Jennifer Moore (Republican) · 31,912 votes 15.9% Write-in · 1,865 votes 0.9% |
| District 11 | Nicole Malliotakis (Republican, leading) · 101,719 votes 56.1% Michael DeCillis (Democratic) · 79,370 votes 43.8% Write-in · 227 votes 0.1% |
| District 12 | Micah Lasher (Democratic, leading) · 193,614 votes 77.2% Caroline Shinkle (Republican) · 50,212 votes 20.0% Karen Ortiz (Independent) · 3,429 votes 1.4% Wilneida Negron (Independent) · 2,894 votes 1.2% Write-in · 632 votes 0.3% |
| District 13 | Darializa Avila Chevalier (Democratic, leading) · 141,014 votes 87.5% Manual "Jomo" Williams (Republican) · 18,308 votes 11.4% Write-in · 1,795 votes 1.1% |
| District 14 | Alexandria Ocasio-Cortez (Democratic, leading) · 107,129 votes 78.2% Diamant Hysenaj (Republican) · 29,505 votes 21.5% Write-in · 322 votes 0.2% |
| District 15 | Ritchie Torres (Democratic, leading) · 93,812 votes 76.8% Stylo Sapaskis (Republican) · 13,004 votes 10.6% Andre Easton (Socialism PSL) · 10,647 votes 8.7% Jose Vega (Independent) · 2,348 votes 1.9% Gonzalo Duran (Conservative) · 2,075 votes 1.7% Write-in · 283 votes 0.2% |
| District 16 | George Latimer (Democratic, leading) · 173,981 votes 75.8% Joseph Cinquemani (Republican) · 54,938 votes 23.9% Write-in · 727 votes 0.3% |
| District 17 | Cait Conley (Democratic, leading) · 167,198 votes 53.0% Mike Lawler (Republican) · 148,207 votes 46.9% Write-in · 341 votes 0.1% |
| District 18 | Pat Ryan (Democratic, leading) · 169,001 votes 62.9% Jacqueline Auringer (Republican) · 99,621 votes 37.1% Write-in · 194 votes 0.1% |
| District 19 | Josh Riley (Democratic, leading) · 167,555 votes 57.3% Peter Oberacker (Republican) · 124,621 votes 42.6% Write-in · 306 votes 0.1% |
| District 20 | Paul Tonko (Democratic, leading) · 183,640 votes 63.7% Ralph Ambrosio (Republican) · 104,538 votes 36.2% Write-in · 252 votes 0.1% |
| District 21 | Anthony Constantino (Republican, leading) · 140,940 votes 50.8% Blake Gendebien (Democratic) · 136,052 votes 49.0% Write-in · 659 votes 0.2% |
| District 22 | John Mannion (Democratic, leading) · 161,630 votes 58.4% Kailee Buller (Republican) · 114,681 votes 41.5% Write-in · 221 votes 0.1% |
| District 23 | Nick Langworthy (Republican, leading) · 182,436 votes 60.2% Aaron Gies (Democratic) · 120,661 votes 39.8% Write-in · 152 votes 0.1% |
| District 24 | Claudia Tenney (Republican, leading) · 171,722 votes 60.3% Alissa Ellman (Democratic) · 112,697 votes 39.6% Write-in · 142 votes 0.0% |
| District 25 | Joseph Morelle (Democratic, leading) · 176,500 votes 62.9% Virginia McIntyre (Republican) · 103,471 votes 36.9% Write-in · 775 votes 0.3% |
| District 26 | Tim Kennedy (Democratic, leading) · 165,081 votes 65.9% Dennis Hannon (Republican) · 84,906 votes 33.9% Write-in · 371 votes 0.1% |
Vote counts come from civicAPI, which gathers the counts published by state election offices; we transcribe them and do not tally.
Bloomberg NewsThe Associated PressNow held by Jon Husted
Counting continues; the result may still change. Fetched 2026-11-16 02:14 UTC. civicAPI
Vote counts come from civicAPI, which gathers the counts published by state election offices; we transcribe them and do not tally.
The latest three surveys as each pollster published them; we show them as released and do not calculate, weight or average them. Percentages are the share of respondents who say they would vote for each candidate. Surveys differ in timing, sample and method, so their numbers are not directly comparable.
| Pollster | Dates | Sample · population | Share who would vote for the candidate |
|---|---|---|---|
| Survey 1602026-10-27 – 2026-11-01 1,122 · likely voters | 2026-10-27 – 2026-11-01 | 1,122 · likely voters | Sherrod Brown 49% Jon Husted 45% |
| The New York Times/Siena University2026-10-26 – 2026-11-01 717 · likely voters | 2026-10-26 – 2026-11-01 | 717 · likely voters | Sherrod Brown 49% Jon Husted 44% |
| Concord Public Opinion Partnerspartisan poll (DEM) · for Education Reform Now Advocacy2026-10-22 – 2026-10-24 469 · likely voters | 2026-10-22 – 2026-10-24 | 469 · likely voters | Sherrod Brown 46% Jon Husted 42% |
Now held by Mike DeWine
Counting continues; the result may still change. Fetched 2026-11-16 02:14 UTC. civicAPI
Vote counts come from civicAPI, which gathers the counts published by state election offices; we transcribe them and do not tally.
The latest three surveys as each pollster published them; we show them as released and do not calculate, weight or average them. Percentages are the share of respondents who say they would vote for each candidate. Surveys differ in timing, sample and method, so their numbers are not directly comparable.
| Pollster | Dates | Sample · population | Share who would vote for the candidate |
|---|---|---|---|
| Survey 1602026-10-27 – 2026-11-01 1,122 · likely voters | 2026-10-27 – 2026-11-01 | 1,122 · likely voters | Amy Acton 50% Vivek Ramaswamy 44% |
| The New York Times/Siena University2026-10-26 – 2026-11-01 717 · likely voters | 2026-10-26 – 2026-11-01 | 717 · likely voters | Amy Acton 49% Vivek Ramaswamy 43% |
| YouGov2026-10-26 – 2026-10-29 2,090 · likely voters | 2026-10-26 – 2026-10-29 | 2,090 · likely voters | Amy Acton 52% Vivek Ramaswamy 46% |
The state has 15 seats in the US House; its current members are 10 Republicans and 5 Democrats. Every seat is up for election on November 3.
Counting continues; the result may still change. Fetched 2026-11-16 02:14 UTC. civicAPI
| District | Candidates and votes |
|---|---|
| District 1 | Greg Landsman (Democratic, leading) · 176,453 votes 54.4% Eric Conroy (Republican) · 139,343 votes 42.9% Nathan Weise (Libertarian) · 8,675 votes 2.7% |
| District 2 | David J. Taylor (Republican, leading) · 175,411 votes 64.2% Jen Mazzuckelli (Democratic) · 97,638 votes 35.8% |
| District 3 | Joyce Beatty (Democratic, leading) · 231,925 votes 77.2% Cleophus Dulaney (Republican) · 68,407 votes 22.8% |
| District 4 | Jim Jordan (Republican, leading) · 197,084 votes 64.5% Joshua D. Kolasinski (Democratic) · 95,497 votes 31.3% Tracey L. Tackett (Independent) · 13,005 votes 4.3% |
| District 5 | Bob Latta (Republican, leading) · 163,382 votes 54.3% Brian A. Shaver (Democratic) · 128,142 votes 42.6% Michael J. Veloff (Libertarian) · 9,577 votes 3.2% |
| District 6 | Michael A. Rulli (Republican, leading) · 163,675 votes 60.4% Elizabeth Kirtley (Democratic) · 107,310 votes 39.6% |
| District 7 | Brian Poindexter (Democratic, leading) · 180,614 votes 54.9% Max Miller (Republican) · 148,177 votes 45.0% Andrey Joseph Martinichin (Write-In) · 237 votes 0.1% Thahbia Asad (Write-In) · 5 votes 0.0% |
| District 8 | Warren Davidson (Republican, leading) · 168,689 votes 52.1% Vanessa Enoch (Democratic) · 154,828 votes 47.9% |
| District 9 | Marcy Kaptur (Democratic, leading) · 159,306 votes 52.7% Derek Merrin (Republican) · 142,830 votes 47.2% Kathy McKinstry (Write-In) · 175 votes 0.1% |
| District 10 | Kristina Knickerbocker (Democratic, leading) · 149,024 votes 49.3% Mike Turner (Republican) · 144,086 votes 47.7% Thomas F. McMasters (Libertarian) · 8,906 votes 2.9% |
| District 11 | Shontel M. Brown (Democratic, leading) · 219,971 votes 83.5% Mike Kirchner (Republican) · 43,373 votes 16.5% |
| District 12 | Troy Balderson (Republican, leading) · 191,926 votes 59.4% Jerrad Christian (Democratic) · 131,211 votes 40.6% |
| District 13 | Emilia Sykes (Democratic, leading) · 190,593 votes 60.0% Carey Coleman (Republican) · 122,078 votes 38.4% Sandeep Dixit (Independent) · 5,104 votes 1.6% |
| District 14 | David P. Joyce (Republican, leading) · 179,467 votes 55.0% Maria Jukic (Democratic) · 146,651 votes 45.0% |
| District 15 | Don Leonard (Democratic, leading) · 149,287 votes 51.9% Mike Carey (Republican) · 130,225 votes 45.3% Brennan Barrington (Libertarian) · 8,135 votes 2.8% Samuel Ronan (Write-In) · 105 votes 0.0% Gary Josephson (Write-In) · 4 votes 0.0% |
Vote counts come from civicAPI, which gathers the counts published by state election offices; we transcribe them and do not tally.
Ars TechnicaNow held by Alan Armstrong
Counting continues; the result may still change. Fetched 2026-11-16 02:14 UTC. civicAPI
Vote counts come from civicAPI, which gathers the counts published by state election offices; we transcribe them and do not tally.
Now held by Kevin Stitt
Counting continues; the result may still change. Fetched 2026-11-16 02:14 UTC. civicAPI
Vote counts come from civicAPI, which gathers the counts published by state election offices; we transcribe them and do not tally.
The state has 5 seats in the US House; its current members are 5 Republicans. Every seat is up for election on November 3.
Counting continues; the result may still change. Fetched 2026-11-16 02:14 UTC. civicAPI
| District | Candidates and votes |
|---|---|
| District 1 | Mark Tedford (Republican, leading) · 121,397 votes 52.3% John Croisant (Democratic) · 110,707 votes 47.7% |
| District 2 | Josh Brecheen (Republican, leading) · 144,054 votes 68.0% Brandon Wade (Democratic) · 61,409 votes 29.0% Ronnie Hopkins (Independent) · 6,520 votes 3.1% |
| District 3 | Frank Lucas (Republican, leading) · 122,181 votes 64.0% Suzie Byrd (Democratic) · 68,832 votes 36.0% |
| District 4 | Tom Cole (Republican, leading) · 125,631 votes 57.6% Mitchell Jacob (Democratic) · 86,108 votes 39.5% Rocco Bonacci (Independent) · 6,389 votes 2.9% |
| District 5 | Stephanie Bice (Republican, leading) · 131,023 votes 49.5% Jena Nelson (Democratic) · 127,687 votes 48.2% Robert P. Henri (Independent) · 4,027 votes 1.5% Austin Nieves (Independent) · 2,047 votes 0.8% |
Vote counts come from civicAPI, which gathers the counts published by state election offices; we transcribe them and do not tally.
No related reports for this state yet.
Now held by Jeff Merkley
Counting continues; the result may still change. Fetched 2026-11-16 02:14 UTC. civicAPI
Vote counts come from civicAPI, which gathers the counts published by state election offices; we transcribe them and do not tally.
Now held by Tina Kotek
Counting continues; the result may still change. Fetched 2026-11-16 02:14 UTC. civicAPI
Vote counts come from civicAPI, which gathers the counts published by state election offices; we transcribe them and do not tally.
The latest three surveys as each pollster published them; we show them as released and do not calculate, weight or average them. Percentages are the share of respondents who say they would vote for each candidate. Surveys differ in timing, sample and method, so their numbers are not directly comparable.
| Pollster | Dates | Sample · population | Share who would vote for the candidate |
|---|---|---|---|
| DHM Researchfor Grow Oregon2026-09-11 – 2026-09-11 600 · likely voters | 2026-09-11 – 2026-09-11 | 600 · likely voters | Tina Kotek 43% Christine Drazan 45% |
| FM3 Researchpartisan poll (DEM) · for Charlie Health2026-01-26 – 2026-02-04 1,065 · likely voters | 2026-01-26 – 2026-02-04 | 1,065 · likely voters | Tina Kotek 45% Christine Drazan 40% |
The state has 6 seats in the US House; its current members are 5 Democrats and 1 Republican. Every seat is up for election on November 3.
Counting continues; the result may still change. Fetched 2026-11-16 02:14 UTC. civicAPI
| District | Candidates and votes |
|---|---|
| District 1 | Suzanne Bonamici (Democratic, leading) · 230,771 votes 71.2% Barbara Kahl (Republican) · 92,675 votes 28.6% Write-in · 535 votes 0.2% |
| District 2 | Cliff Bentz (Republican, leading) · 189,687 votes 61.5% Chris Beck (Democratic) · 118,585 votes 38.4% Write-in · 401 votes 0.1% |
| District 3 | Maxine Dexter (Democratic, leading) · 236,480 votes 77.4% Loran Ayles (Republican) · 68,521 votes 22.4% Write-in · 679 votes 0.2% |
| District 4 | Val Hoyle (Democratic, leading) · 183,102 votes 53.6% Monique DeSpain (Republican) · 145,997 votes 42.8% Justin Filip (Pacific Green) · 11,898 votes 3.5% Write-in · 426 votes 0.1% |
| District 5 | Janelle Bynum (Democratic, leading) · 195,056 votes 53.8% Patti Adair (Republican) · 158,996 votes 43.9% Andrea Townsend (Pacific Green) · 8,033 votes 2.2% Write-in · 296 votes 0.1% |
| District 6 | Andrea Salinas (Democratic, leading) · 177,257 votes 58.3% David Russ (Republican) · 126,237 votes 41.5% Write-in · 352 votes 0.1% |
Vote counts come from civicAPI, which gathers the counts published by state election offices; we transcribe them and do not tally.
No related reports for this state yet.
No official results for this state yet. Official state results page
Now held by Josh Shapiro
Counting continues; the result may still change. Fetched 2026-11-16 02:14 UTC. civicAPI
Vote counts come from civicAPI, which gathers the counts published by state election offices; we transcribe them and do not tally.
The latest three surveys as each pollster published them; we show them as released and do not calculate, weight or average them. Percentages are the share of respondents who say they would vote for each candidate. Surveys differ in timing, sample and method, so their numbers are not directly comparable.
| Pollster | Dates | Sample · population | Share who would vote for the candidate |
|---|---|---|---|
| ActiVote2026-10-01 – 2026-10-21 400 · likely voters | 2026-10-01 – 2026-10-21 | 400 · likely voters | Josh Shapiro 61.5% Stacy Garrity 38.5% |
| Z to A Research2026-09-28 – 2026-10-01 630 · likely voters | 2026-09-28 – 2026-10-01 | 630 · likely voters | Josh Shapiro 53% Stacy Garrity 34% Ken Krawchuk 3% |
| Bravo Groupfor PennLive2026-09-16 – 2026-09-22 624 · registered voters | 2026-09-16 – 2026-09-22 | 624 · registered voters | Josh Shapiro 55% Stacy Garrity 28% |
The state has 17 seats in the US House; its current members are 10 Republicans and 7 Democrats. Every seat is up for election on November 3.
Counting continues; the result may still change. Fetched 2026-11-16 02:14 UTC. civicAPI
| District | Candidates and votes |
|---|---|
| District 1 | Bob Harvie (Democratic, leading) · 189,795 votes 52.9% Brian Fitzpatrick (Republican) · 169,233 votes 47.1% |
| District 2 | Brendan Boyle (Democratic, leading) · 150,647 votes 80.9% Jessica Arriaga (Republican) · 35,662 votes 19.1% |
| District 3 | Chris Rabb (Democratic, leading) · 258,169 votes 93.6% Dennis Mahoney (The Independent Party) · 17,619 votes 6.4% |
| District 4 | Madeleine Dean (Democratic, leading) · 233,156 votes 67.2% Aurora Stuski (Republican) · 113,871 votes 32.8% |
| District 5 | Mary Gay Scanlon (Democratic, leading) · 215,673 votes 72.2% Nicholas Manganaro (Republican) · 83,059 votes 27.8% |
| District 6 | Chrissy Houlahan (Democratic, leading) · 201,238 votes 64.5% Marty Young (Republican) · 110,836 votes 35.5% |
| District 7 | Bob Brooks (Democratic, leading) · 165,509 votes 56.2% Ryan Mackenzie (Republican) · 129,072 votes 43.8% |
| District 8 | Paige Cognetti (Democratic, leading) · 154,060 votes 54.5% Rob Bresnahan (Republican) · 128,739 votes 45.5% |
| District 9 | Dan Meuser (Republican, leading) · 165,751 votes 61.4% Rachel Wallace (Democratic) · 104,027 votes 38.6% |
| District 10 | Janelle Stelson (Democratic, leading) · 175,174 votes 55.2% Scott Perry (Republican) · 142,253 votes 44.8% |
| District 11 | Lloyd Smucker (Republican, leading) · 167,894 votes 55.4% Nancy Mannion (Democratic) · 135,225 votes 44.6% |
| District 12 | Summer Lee (Democratic, leading) · 196,365 votes 65.6% James Hayes (Republican) · 102,807 votes 34.4% |
| District 13 | John Joyce (Republican, leading) · 189,919 votes 67.4% Beth Farnham (Democratic) · 91,726 votes 32.6% |
| District 14 | Guy Reschenthaler (Republican, leading) · 159,216 votes 57.5% Alan Bradstock (Democratic) · 117,701 votes 42.5% |
| District 15 | Glenn Thompson (Republican, leading) · 171,287 votes 63.8% Ray Bilger (Democratic) · 97,260 votes 36.2% |
| District 16 | Mike Kelly (Republican, leading) · 154,693 votes 53.8% Justin Wagner (Democratic) · 132,690 votes 46.2% |
| District 17 | Chris Deluzio (Democratic, leading) · 208,847 votes 62.9% Tony Guy (Republican) · 123,115 votes 37.1% |
Vote counts come from civicAPI, which gathers the counts published by state election offices; we transcribe them and do not tally.
Now held by Jack Reed
Counting continues; the result may still change. Fetched 2026-11-16 02:14 UTC. civicAPI
Vote counts come from civicAPI, which gathers the counts published by state election offices; we transcribe them and do not tally.
The latest three surveys as each pollster published them; we show them as released and do not calculate, weight or average them. Percentages are the share of respondents who say they would vote for each candidate. Surveys differ in timing, sample and method, so their numbers are not directly comparable.
| Pollster | Dates | Sample · population | Share who would vote for the candidate |
|---|---|---|---|
| University of New Hampshire2026-10-27 – 2026-10-31 753 · likely voters | 2026-10-27 – 2026-10-31 | 753 · likely voters | Jack Reed 63% Raymond McKay 32% Michael Bahry 3% |
| Embold Researchfor Salve Regina University Pell Center for International Relations and Public Policy2026-10-05 – 2026-10-08 815 · likely voters | 2026-10-05 – 2026-10-08 | 815 · likely voters | Jack Reed 55% Raymond McKay 32% Michael Bahry 4% |
| University of New Hampshire2026-09-17 – 2026-09-21 598 · likely voters | 2026-09-17 – 2026-09-21 | 598 · likely voters | Jack Reed 53% Raymond McKay 33% Michael Bahry 5% |
Now held by Dan McKee
Counting continues; the result may still change. Fetched 2026-11-16 02:14 UTC. civicAPI
Vote counts come from civicAPI, which gathers the counts published by state election offices; we transcribe them and do not tally.
The state has 2 seats in the US House; its current members are 2 Democrats. Every seat is up for election on November 3.
Counting continues; the result may still change. Fetched 2026-11-16 02:14 UTC. civicAPI
| District | Candidates and votes |
|---|---|
| District 1 | Gabriel Amo (Democratic, leading) · 112,107 votes 68.6% Kellie Keenan (Republican) · 44,901 votes 27.5% Pedro DeSouza (Independent) · 6,211 votes 3.8% Write-in · 229 votes 0.1% |
| District 2 | Seth Magaziner (Democratic, leading) · 121,020 votes 61.9% Victor Mellor (Republican) · 73,905 votes 37.8% Write-in · 511 votes 0.3% |
Vote counts come from civicAPI, which gathers the counts published by state election offices; we transcribe them and do not tally.
No related reports for this state yet.
Now held by Darline Graham
2312 of 2312 precincts have reported results (all). The state election office has certified the result. Official count as of 2026-11-10 22:22 UTC. Official state results page
“Reported” counts the units that have sent in results; it is not the share of votes counted. Most states release early and mail ballots first, in batches, and mail ballots may still be counted after Election Day.
Vote counts are transcribed from each state’s official results page; we do not tally them.
The latest three surveys as each pollster published them; we show them as released and do not calculate, weight or average them. Percentages are the share of respondents who say they would vote for each candidate. Surveys differ in timing, sample and method, so their numbers are not directly comparable.
| Pollster | Dates | Sample · population | Share who would vote for the candidate |
|---|---|---|---|
| Resonance Media Services2026-10-30 – 2026-10-30 600 · likely voters | 2026-10-30 – 2026-10-30 | 600 · likely voters | Darline Graham 44.6% Annie Andrews 46.2% |
| Targoz Market Researchfor South Carolina Policy Council2026-10-16 – 2026-10-25 895 · likely voters | 2026-10-16 – 2026-10-25 | 895 · likely voters | Darline Graham 47% Annie Andrews 46% Kasie Whitener 2% Mark Hackett 1% |
| East Carolina University2026-10-19 – 2026-10-24 955 · likely voters | 2026-10-19 – 2026-10-24 | 955 · likely voters | Darline Graham 51% Annie Andrews 47% Kasie Whitener 1% Mark Hackett 1% |
Now held by Henry McMaster
2312 of 2312 precincts have reported results (all). The state election office has certified the result. Official count as of 2026-11-10 22:22 UTC. Official state results page
“Reported” counts the units that have sent in results; it is not the share of votes counted. Most states release early and mail ballots first, in batches, and mail ballots may still be counted after Election Day.
Vote counts are transcribed from each state’s official results page; we do not tally them.
The latest three surveys as each pollster published them; we show them as released and do not calculate, weight or average them. Percentages are the share of respondents who say they would vote for each candidate. Surveys differ in timing, sample and method, so their numbers are not directly comparable.
| Pollster | Dates | Sample · population | Share who would vote for the candidate |
|---|---|---|---|
| Resonance Media Services2026-10-30 – 2026-10-30 600 · likely voters | 2026-10-30 – 2026-10-30 | 600 · likely voters | Alan Wilson 50.6% Jermaine Johnson 42.3% |
| Targoz Market Researchfor South Carolina Policy Council2026-10-16 – 2026-10-25 895 · likely voters | 2026-10-16 – 2026-10-25 | 895 · likely voters | Alan Wilson 51% Jermaine Johnson 41% Michael Addison 1% Walid Hakim 1% |
| Trafalgar Grouppartisan poll (REP)2026-10-16 – 2026-10-18 1,095 · likely voters | 2026-10-16 – 2026-10-18 | 1,095 · likely voters | Alan Wilson 52.5% Jermaine Johnson 36.5% Michael Addison 4.2% Walid Hakim 1.6% |
The state has 7 seats in the US House; its current members are 6 Republicans and 1 Democrat. Every seat is up for election on November 3.
Counting continues; the result may still change. Fetched 2026-11-16 02:14 UTC. civicAPI
| District | Candidates and votes |
|---|---|
| District 1 | Nancy Lacore (Democratic, leading) · 162,103 votes 49.7% Jenny Costa Honeycutt (Republican) · 158,751 votes 48.6% Bill Reeside (Libertarian) · 5,351 votes 1.6% Write-in · 218 votes 0.1% |
| District 2 | Joe Wilson (Republican, leading) · 147,791 votes 49.8% Zyon Khalifa (Democratic) · 144,865 votes 48.8% Dayna Alane Smith (Workers) · 3,674 votes 1.2% Write-in · 334 votes 0.1% |
| District 3 | Sheri Biggs (Republican, leading) · 173,968 votes 63.7% Eunice Lehmacher (Democratic) · 93,962 votes 34.4% Brian Corriea (Libertarian) · 5,112 votes 1.9% Write-in · 150 votes 0.1% |
| District 4 | William Timmons (Republican, leading) · 146,944 votes 51.7% Courtney McClain (Democratic) · 129,742 votes 45.7% Jessica Ethridge (Libertarian) · 7,215 votes 2.5% Write-in · 292 votes 0.1% |
| District 5 | Wes Climer (Republican, leading) · 151,611 votes 52.8% Mallory Dittmer (Democratic) · 135,234 votes 47.1% Write-in · 155 votes 0.1% |
| District 6 | Jim Clyburn (Democratic, leading) · 181,118 votes 69.3% John Peterson (Republican) · 79,898 votes 30.6% Write-in · 318 votes 0.1% |
| District 7 | Russell Fry (Republican, leading) · 172,439 votes 56.7% John Vincent (Democratic) · 131,445 votes 43.2% Write-in · 204 votes 0.1% |
Vote counts come from civicAPI, which gathers the counts published by state election offices; we transcribe them and do not tally.
The Associated PressNow held by Mike Rounds
Counting continues; the result may still change. Fetched 2026-11-16 02:14 UTC. civicAPI
Vote counts come from civicAPI, which gathers the counts published by state election offices; we transcribe them and do not tally.
The latest three surveys as each pollster published them; we show them as released and do not calculate, weight or average them. Percentages are the share of respondents who say they would vote for each candidate. Surveys differ in timing, sample and method, so their numbers are not directly comparable.
| Pollster | Dates | Sample · population | Share who would vote for the candidate |
|---|---|---|---|
| Concord Public Opinion Partnerspartisan poll (DEM) · for Democrats for Education Reform2026-10-22 – 2026-10-26 448 · likely voters | 2026-10-22 – 2026-10-26 | 448 · likely voters | Mike Rounds 41% Brian Bengs 43% |
| Emerson Collegefor KELO-TV2026-10-19 – 2026-10-20 803 · likely voters | 2026-10-19 – 2026-10-20 | 803 · likely voters | Mike Rounds 50% Brian Bengs 42% |
| Quantus Insights2026-10-17 – 2026-10-19 657 · likely voters | 2026-10-17 – 2026-10-19 | 657 · likely voters | Mike Rounds 59% Brian Bengs 37% |
Now held by Larry Rhoden
Counting continues; the result may still change. Fetched 2026-11-16 02:14 UTC. civicAPI
Vote counts come from civicAPI, which gathers the counts published by state election offices; we transcribe them and do not tally.
The latest three surveys as each pollster published them; we show them as released and do not calculate, weight or average them. Percentages are the share of respondents who say they would vote for each candidate. Surveys differ in timing, sample and method, so their numbers are not directly comparable.
| Pollster | Dates | Sample · population | Share who would vote for the candidate |
|---|---|---|---|
| Concord Public Opinion Partnerspartisan poll (DEM) · for Democrats for Education Reform2026-10-22 – 2026-10-26 448 · likely voters | 2026-10-22 – 2026-10-26 | 448 · likely voters | Larry Rhoden 48% Dan Ahlers 39% |
| Emerson Collegefor KELO-TV2026-10-19 – 2026-10-20 803 · likely voters | 2026-10-19 – 2026-10-20 | 803 · likely voters | Larry Rhoden 60% Dan Ahlers 41% |
The state has 1 seats in the US House; its current members are 1 Republican. Every seat is up for election on November 3.
Counting continues; the result may still change. Fetched 2026-11-16 02:14 UTC. civicAPI
| District | Candidates and votes |
|---|---|
| At-large | Marty Jackley (Republican, leading) · 195,588 votes 64.0% Nikki Gronli (Democratic) · 109,997 votes 36.0% |
Vote counts come from civicAPI, which gathers the counts published by state election offices; we transcribe them and do not tally.
No related reports for this state yet.
Now held by Bill Hagerty
Counting continues; the result may still change. Fetched 2026-11-16 02:14 UTC. civicAPI
Vote counts come from civicAPI, which gathers the counts published by state election offices; we transcribe them and do not tally.
The latest three surveys as each pollster published them; we show them as released and do not calculate, weight or average them. Percentages are the share of respondents who say they would vote for each candidate. Surveys differ in timing, sample and method, so their numbers are not directly comparable.
| Pollster | Dates | Sample · population | Share who would vote for the candidate |
|---|---|---|---|
| Targoz Market Researchfor Beacon Center of Tennessee2026-08-15 – 2026-08-26 1,157 · registered voters | 2026-08-15 – 2026-08-26 | 1,157 · registered voters | Bill Hagerty 51% Marquita Bradshaw 31% |
Now held by Bill Lee
Counting continues; the result may still change. Fetched 2026-11-16 02:14 UTC. civicAPI
Vote counts come from civicAPI, which gathers the counts published by state election offices; we transcribe them and do not tally.
The latest three surveys as each pollster published them; we show them as released and do not calculate, weight or average them. Percentages are the share of respondents who say they would vote for each candidate. Surveys differ in timing, sample and method, so their numbers are not directly comparable.
| Pollster | Dates | Sample · population | Share who would vote for the candidate |
|---|---|---|---|
| Spry Strategies2026-10-10 – 2026-10-16 635 · likely voters | 2026-10-10 – 2026-10-16 | 635 · likely voters | Marsha Blackburn 44% Jerri Green 32% David Hatley 12% Lauren Pinkston 1% |
| TargetSmartpartisan poll (DEM) · for The Progress Fund2026-09-09 – 2026-09-12 600 · likely voters | 2026-09-09 – 2026-09-12 | 600 · likely voters | Marsha Blackburn 45% Jerri Green 36% David Hatley 19% Lauren Pinkston 2% |
| Targoz Market Researchfor Beacon Center of Tennessee2026-08-15 – 2026-08-26 1,149 · registered voters | 2026-08-15 – 2026-08-26 | 1,149 · registered voters | Marsha Blackburn 46% Jerri Green 33% Independent 8% |
The state has 9 seats in the US House; its current members are 8 Republicans and 1 Democrat. Every seat is up for election on November 3.
Counting continues; the result may still change. Fetched 2026-11-16 02:14 UTC. civicAPI
| District | Candidates and votes |
|---|---|
| District 1 | Diana Harshbarger (Republican, leading) · 133,592 votes 63.8% Kristi Burke (Democratic) · 69,207 votes 33.1% Joshua Ray Ashburn (Independent) · 2,102 votes 1.0% Billy Cody (Independent) · 1,398 votes 0.7% Chris Campbell (Independent) · 1,296 votes 0.6% Richard G. Baker (Independent) · 1,219 votes 0.6% Tyler Brice Mitchell McClain (Independent) · 541 votes 0.3% |
| District 2 | Tim Burchett (Republican, leading) · 144,892 votes 57.7% Michaela Barnett (Democratic) · 103,311 votes 41.2% Bruce Fine (Independent) · 1,827 votes 0.7% Adam Heimerman (Independent) · 950 votes 0.4% |
| District 3 | Chuck Fleischmann (Republican, leading) · 136,110 votes 57.6% Anna Golladay (Democratic) · 95,051 votes 40.2% Dean Arnold (Independent) · 2,136 votes 0.9% Rodney Joe King (Independent) · 1,207 votes 0.5% Jean Howard-Hill (Independent) · 923 votes 0.4% Donnie Lynn Ownby (Independent) · 527 votes 0.2% Edward John Roland (Independent) · 404 votes 0.2% |
| District 4 | Victoria Broderick (Democratic, leading) · 95,585 votes 48.9% Scott DesJarlais (Republican) · 95,305 votes 48.7% Jacob Kristopher Anders (Independent) · 2,833 votes 1.4% Clay Faircloth (Independent) · 1,853 votes 0.9% |
| District 5 | Charlie Hatcher (Republican, leading) · 110,408 votes 51.7% Chaz Molder (Democratic) · 99,841 votes 46.7% James A. Johnson (Independent) · 2,641 votes 1.2% Micheál O'Leary (Independent) · 815 votes 0.4% |
| District 6 | Johnny Garrett (Republican, leading) · 120,950 votes 50.8% Mike Croley (Democratic) · 113,177 votes 47.5% Christopher B. Monday (Independent) · 2,707 votes 1.1% Angus Purdy (Independent) · 1,390 votes 0.6% |
| District 7 | Matt Van Epps (Republican, leading) · 121,100 votes 50.3% Darden Copeland (Democratic) · 115,867 votes 48.1% Andrew J. Koontz (Independent) · 2,603 votes 1.1% Lowell Reynolds (Independent) · 1,316 votes 0.5% |
| District 8 | David Kustoff (Republican, leading) · 114,045 votes 51.6% Heidi Kuhn (Democratic) · 102,406 votes 46.4% Pamela Jeanine "P." Moses (Independent) · 1,035 votes 0.5% Horace Taylor (Independent) · 861 votes 0.4% Adam D. Austill (Independent) · 854 votes 0.4% Wendell "Wells" Blankenship (Independent) · 714 votes 0.3% Antonio Futch (Independent) · 506 votes 0.2% Henry J. Ward, III (Independent) · 485 votes 0.2% |
| District 9 | Brent Taylor (Republican, leading) · 111,968 votes 49.6% Justin Pearson (Democratic) · 109,429 votes 48.5% Dennis Clark (Independent) · 2,413 votes 1.1% Michelle Davis Head (Independent) · 1,804 votes 0.8% |
Vote counts come from civicAPI, which gathers the counts published by state election offices; we transcribe them and do not tally.
No related reports for this state yet.
Now held by John Cornyn
5303 of 5303 polling places have reported results (all). The result is not yet certified and may still change. Official count as of 2026-11-04 22:48 UTC. Official state results page
“Reported” counts the units that have sent in results; it is not the share of votes counted. Most states release early and mail ballots first, in batches, and mail ballots may still be counted after Election Day.
Vote counts are transcribed from each state’s official results page; we do not tally them.
The latest three surveys as each pollster published them; we show them as released and do not calculate, weight or average them. Percentages are the share of respondents who say they would vote for each candidate. Surveys differ in timing, sample and method, so their numbers are not directly comparable.
| Pollster | Dates | Sample · population | Share who would vote for the candidate |
|---|---|---|---|
| The New York Times/Siena University2026-10-27 – 2026-11-01 1,215 · likely voters | 2026-10-27 – 2026-11-01 | 1,215 · likely voters | James Talarico 50% Ken Paxton 43% |
| Quantus Insights2026-10-26 – 2026-10-28 1,221 · likely voters | 2026-10-26 – 2026-10-28 | 1,221 · likely voters | Ken Paxton 49.4% James Talarico 48.4% |
| ActiVote2026-10-22 – 2026-10-28 400 · likely voters | 2026-10-22 – 2026-10-28 | 400 · likely voters | James Talarico 52.1% Ken Paxton 47.9% |
Now held by Greg Abbott
5303 of 5303 polling places have reported results (all). The result is not yet certified and may still change. Official count as of 2026-11-04 22:48 UTC. Official state results page
“Reported” counts the units that have sent in results; it is not the share of votes counted. Most states release early and mail ballots first, in batches, and mail ballots may still be counted after Election Day.
Vote counts are transcribed from each state’s official results page; we do not tally them.
The latest three surveys as each pollster published them; we show them as released and do not calculate, weight or average them. Percentages are the share of respondents who say they would vote for each candidate. Surveys differ in timing, sample and method, so their numbers are not directly comparable.
| Pollster | Dates | Sample · population | Share who would vote for the candidate |
|---|---|---|---|
| The New York Times/Siena University2026-10-27 – 2026-11-01 1,215 · likely voters | 2026-10-27 – 2026-11-01 | 1,215 · likely voters | Greg Abbott 47% Gina Hinojosa 48% |
| YouGov2026-10-26 – 2026-10-29 2,141 · likely voters | 2026-10-26 – 2026-10-29 | 2,141 · likely voters | Greg Abbott 50% Gina Hinojosa 49% |
| ActiVote2026-10-23 – 2026-10-29 400 · likely voters | 2026-10-23 – 2026-10-29 | 400 · likely voters | Greg Abbott 52.1% Gina Hinojosa 47.9% |
The state has 37 seats in the US House; its current members are 24 Republicans and 13 Democrats. Every seat is up for election on November 3.
Counting continues; the result may still change. Fetched 2026-11-16 02:14 UTC. civicAPI
| District | Candidates and votes |
|---|---|
| District 1 | Nathaniel Moran (Republican, leading) · 181,987 votes 69.0% Yolanda Prince (Democratic) · 81,598 votes 31.0% |
| District 2 | Steve Toth (Republican, leading) · 144,881 votes 51.0% Shaun Finnie (Democratic) · 139,384 votes 49.0% |
| District 3 | Keith Self (Republican, leading) · 169,276 votes 52.7% Evan Hunt (Democratic) · 151,689 votes 47.3% |
| District 4 | Pat Fallon (Republican, leading) · 171,745 votes 56.0% Jason Pearce (Democratic) · 134,720 votes 44.0% |
| District 5 | Lance Gooden (Republican, leading) · 130,327 votes 51.5% Chelsey Hockett (Democratic) · 122,969 votes 48.5% |
| District 6 | Jake Ellzey (Republican, leading) · 140,111 votes 52.1% Danny Minton (Democratic) · 128,566 votes 47.9% |
| District 7 | Lizzie Fletcher (Democratic, leading) · 161,126 votes 70.9% Alexander Hale (Republican) · 62,600 votes 27.5% Espoir Ngabo (Green) · 3,662 votes 1.6% |
| District 8 | Jessica Steinmann (Republican, leading) · 141,874 votes 53.2% Laura Jones (Democratic) · 124,840 votes 46.8% |
| District 9 | Leticia Gutierrez (Democratic, leading) · 98,269 votes 57.6% Alex Mealer (Republican) · 72,445 votes 42.4% |
| District 10 | Chris Gober (Republican, leading) · 161,425 votes 53.8% Caitlin Rourk (Democratic) · 138,832 votes 46.2% |
| District 11 | August Pfluger (Republican, leading) · 138,627 votes 59.5% Claire Reynolds (Democratic) · 94,353 votes 40.5% |
| District 12 | Craig Goldman (Republican, leading) · 144,714 votes 53.1% Angela Rodriguez Prilliman (Democratic) · 127,828 votes 46.9% |
| District 13 | Ronny Jackson (Republican, leading) · 158,206 votes 65.2% Mark Nair (Democratic) · 84,385 votes 34.8% |
| District 14 | Randy Weber (Republican, leading) · 152,776 votes 54.0% Thurman Bartie (Democratic) · 130,169 votes 46.0% |
| District 15 | Bobby Pulido (Democratic, leading) · 126,395 votes 62.3% Monica De La Cruz (Republican) · 76,375 votes 37.7% |
| District 16 | Veronica Escobar (Democratic, leading) · 139,555 votes 70.8% Adam Bauman (Republican) · 57,562 votes 29.2% |
| District 17 | Pete Sessions (Republican, leading) · 143,558 votes 53.6% Casey Shepard (Democratic) · 124,469 votes 46.4% |
| District 18 | Christian Menefee (Democratic, leading) · 193,768 votes 86.0% Ronald Whitfield (Republican) · 31,438 votes 14.0% |
| District 19 | Tom Sell (Republican, leading) · 154,079 votes 69.5% Kyle Rable (Democratic) · 67,674 votes 30.5% |
| District 20 | Joaquin Castro (Democratic, leading) · 151,058 votes 77.6% Edgardo Baez (Republican) · 43,562 votes 22.4% |
| District 21 | Mark Teixeira (Republican, leading) · 194,898 votes 54.5% Kristin Hook (Democratic) · 163,021 votes 45.5% |
| District 22 | Trever Nehls (Republican, leading) · 150,520 votes 51.8% Marquette Greene-Scott (Democratic) · 140,115 votes 48.2% |
| District 23 | Katy Padilla Stout (Democratic, leading) · 143,130 votes 52.2% Brandon Herrera (Republican) · 120,566 votes 43.9% Ben Mendoza (Independent) · 10,658 votes 3.9% |
| District 24 | Beth Van Duyne (Republican, leading) · 172,011 votes 53.4% Kevin Burge (Democratic) · 150,125 votes 46.6% |
| District 25 | Roger Williams (Republican, leading) · 142,827 votes 53.7% Dione Sims (Democratic) · 123,079 votes 46.3% |
| District 26 | Brandon Gill (Republican, leading) · 183,221 votes 54.5% Steven Shook (Democratic) · 148,596 votes 44.2% Phil Gray (Libertarian) · 4,317 votes 1.3% |
| District 27 | Michael Cloud (Republican, leading) · 144,627 votes 51.1% Tanya Lloyd (Democratic) · 138,072 votes 48.8% Write-in · 89 votes 0.0% Wayne Raasch (Write-In) · 22 votes 0.0% |
| District 28 | Henry Cuellar (Democratic, leading) · 113,433 votes 65.8% Tano Tijerina (Republican) · 51,126 votes 29.6% Marlón Durán (Green) · 7,939 votes 4.6% |
| District 29 | Sylvia Garcia (Democratic, leading) · 134,277 votes 79.9% Martha Fierro (Republican) · 33,698 votes 20.1% |
| District 30 | Frederick Haynes III (Democratic, leading) · 187,119 votes 82.6% Everett Jackson (Republican) · 39,306 votes 17.4% |
| District 31 | John Carter (Republican, leading) · 164,167 votes 53.8% Justin Early (Democratic) · 136,961 votes 44.9% Greg Stoker (Green) · 4,232 votes 1.4% |
| District 32 | Jace Yarbrough (Republican, leading) · 142,977 votes 51.4% Dan Barrios (Democratic) · 134,945 votes 48.6% |
| District 33 | Colin Allred (Democratic, leading) · 151,093 votes 78.4% Patrick Gillespie (Republican) · 41,198 votes 21.4% Write-in · 348 votes 0.2% Michelle Craig (Write-In) · 52 votes 0.0% |
| District 34 | Vicente Gonzalez (Democratic, leading) · 112,667 votes 55.6% Eric Flores (Republican) · 80,572 votes 39.8% Eddie Espinoza (Green) · 4,740 votes 2.3% Chris Royal (Libertarian) · 4,666 votes 2.3% |
| District 35 | Johnny Garcia (Democratic, leading) · 140,973 votes 55.5% Carlos De La Cruz (Republican) · 113,112 votes 44.5% |
| District 36 | Brian Babin (Republican, leading) · 138,121 votes 53.5% Rhonda Hart (Democratic) · 119,848 votes 46.5% |
| District 37 | Greg Casar (Democratic, leading) · 254,957 votes 83.8% Lauren Peña (Republican) · 49,469 votes 16.2% |
| District 38 | Jon Bonck (Republican, leading) · 157,590 votes 51.5% Melissa McDonough (Democratic) · 144,833 votes 47.3% Alex McMenemy (Green) · 3,455 votes 1.1% |
Vote counts come from civicAPI, which gathers the counts published by state election offices; we transcribe them and do not tally.
ReutersCNNFox NewsNo official results for this state yet.
Now held by Spencer Cox
No official results for this state yet.
The state has 4 seats in the US House; its current members are 4 Republicans. Every seat is up for election on November 3.
Counting continues; the result may still change. Fetched 2026-11-16 02:14 UTC. civicAPI
| District | Candidates and votes |
|---|---|
| District 1 | Ben McAdams (Democratic, leading) · 174,492 votes 70.0% Riley Owen (Republican) · 65,190 votes 26.2% Jesse West (Libertarian) · 5,707 votes 2.3% Elias Henry Montgomery (Unaffiliated) · 3,593 votes 1.4% Babak "Bobby" Darvish (Unaffiliated) · 76 votes 0.0% Write-in · 76 votes 0.0% |
| District 2 | Blake Moore (Republican, leading) · 128,006 votes 49.8% Peter Crosby (Democratic) · 109,504 votes 42.6% Carlton E. Bowen (Independent American) · 8,522 votes 3.3% Robert M. Moesinger (Unaffiliated) · 6,593 votes 2.6% Daniel Cottam (Libertarian) · 4,634 votes 1.8% |
| District 3 | Celeste Maloy (Republican, leading) · 145,942 votes 56.6% Kent Udell (Democratic) · 91,988 votes 35.7% Cassie Easley (Constitution) · 8,064 votes 3.1% Michael R. Stoddard (Libertarian) · 5,759 votes 2.2% Ayden Scott (Unaffiliated) · 4,254 votes 1.6% Adonis Hooslyn (Unaffiliated) · 1,833 votes 0.7% |
| District 4 | Mike Kennedy (Republican, leading) · 142,819 votes 53.5% Jonny Larsen (Democratic) · 104,009 votes 38.9% Steven Burt (Unaffiliated) · 11,542 votes 4.3% Taylor Wright (Libertarian) · 8,664 votes 3.2% |
Vote counts come from civicAPI, which gathers the counts published by state election offices; we transcribe them and do not tally.
No related reports for this state yet.
Now held by Mark R. Warner
Counting continues; the result may still change. Fetched 2026-11-16 02:14 UTC. civicAPI
Vote counts come from civicAPI, which gathers the counts published by state election offices; we transcribe them and do not tally.
Now held by Abigail Spanberger
No official results for this state yet.
The state has 11 seats in the US House; its current members are 6 Democrats and 5 Republicans. Every seat is up for election on November 3.
Counting continues; the result may still change. Fetched 2026-11-16 02:14 UTC. civicAPI
| District | Candidates and votes |
|---|---|
| District 1 | Shannon Taylor (Democratic, leading) · 212,154 votes 51.3% Rob Wittman (Republican) · 200,049 votes 48.4% Write-in · 1,021 votes 0.2% |
| District 2 | Elaine Luria (Democratic, leading) · 182,932 votes 53.3% Jen Kiggans (Republican) · 152,130 votes 44.3% J. Matt Baker (Independent) · 4,913 votes 1.4% Geral D. "Bishop" Staten (Independent) · 3,137 votes 0.9% Write-in · 415 votes 0.1% |
| District 3 | Bobby Scott (Democratic, leading) · 186,251 votes 72.9% Edwin Rivera (Republican) · 60,387 votes 23.6% Makiba A. Gaines (Independent) · 4,219 votes 1.7% Stephen C. Woll (Independent) · 4,067 votes 1.6% Write-in · 532 votes 0.2% |
| District 4 | Jennifer McClellan (Democratic, leading) · 230,609 votes 72.6% Robert Murray (Republican) · 81,794 votes 25.8% Joan E. "Andrews" Bell (Independent) · 4,289 votes 1.4% Write-in · 762 votes 0.2% |
| District 5 | John McGuire (Republican, leading) · 184,142 votes 49.9% Tom Perriello (Democratic) · 178,403 votes 48.3% Cooke C. Harvey (Independent) · 5,992 votes 1.6% Write-in · 749 votes 0.2% |
| District 6 | Ben Cline (Republican, leading) · 177,180 votes 55.0% Beth Macy (Democratic) · 144,195 votes 44.8% Write-in · 625 votes 0.2% |
| District 7 | Eugene Vindman (Democratic, leading) · 196,075 votes 60.0% Doug Ollivant (Republican) · 122,195 votes 37.4% Alaha Ahrar (Independent) · 3,195 votes 1.0% Taner E. Demirci Lopez (Libertarian) · 2,734 votes 0.8% Randall A. Terry (Independent) · 1,232 votes 0.4% Joshua E. Ertle (Independent) · 811 votes 0.2% Write-in · 556 votes 0.2% |
| District 8 | Don Beyer (Democratic, leading) · 259,261 votes 79.5% Tony Sabio (Republican) · 57,992 votes 17.8% Tim S. Sharman (Independent) · 4,138 votes 1.3% Shelly M. Arnoldi (Libertarian) · 3,883 votes 1.2% Write-in · 899 votes 0.3% |
| District 9 | Morgan Griffith (Republican, leading) · 195,307 votes 65.3% Joy Powers (Democratic) · 103,087 votes 34.5% Write-in · 610 votes 0.2% |
| District 10 | Suhas Subramanyam (Democratic, leading) · 207,223 votes 61.7% Dave Beckwith (Republican) · 122,089 votes 36.3% Ahsen Mujeeb Malik (Independent) · 6,145 votes 1.8% Write-in · 657 votes 0.2% |
| District 11 | James Walkinshaw (Democratic, leading) · 256,593 votes 74.3% Arthur Purves (Republican) · 83,080 votes 24.1% Dianne L. Blais (Green) · 4,377 votes 1.3% Write-in · 1,095 votes 0.3% |
Vote counts come from civicAPI, which gathers the counts published by state election offices; we transcribe them and do not tally.
No official results for this state yet.
Now held by Phil Scott
Counting continues; the result may still change. Fetched 2026-11-16 02:14 UTC. civicAPI
Vote counts come from civicAPI, which gathers the counts published by state election offices; we transcribe them and do not tally.
The latest three surveys as each pollster published them; we show them as released and do not calculate, weight or average them. Percentages are the share of respondents who say they would vote for each candidate. Surveys differ in timing, sample and method, so their numbers are not directly comparable.
| Pollster | Dates | Sample · population | Share who would vote for the candidate |
|---|---|---|---|
| State Navigate2026-10-23 – 2026-10-25 1,752 · likely voters | 2026-10-23 – 2026-10-25 | 1,752 · likely voters | Phil Scott 49% Amanda Janoo 46% |
The state has 1 seats in the US House; its current members are 1 Democrat. Every seat is up for election on November 3.
Counting continues; the result may still change. Fetched 2026-11-16 02:14 UTC. civicAPI
| District | Candidates and votes |
|---|---|
| At-large | Becca Balint (Democratic, leading) · 198,758 votes 65.2% Gerald Malloy (Republican) · 94,078 votes 30.9% Suzanne "Suz" Seymour (Independent) · 4,362 votes 1.4% Ryan P. Walton (Independent) · 2,700 votes 0.9% Phoenix K. Altair (Independent) · 2,335 votes 0.8% Adam Ortiz (Independent) · 2,196 votes 0.7% Write-in · 246 votes 0.1% |
Vote counts come from civicAPI, which gathers the counts published by state election offices; we transcribe them and do not tally.
No related reports for this state yet.
No official results for this state yet.
Now held by Bob Ferguson
No official results for this state yet.
The state has 10 seats in the US House; its current members are 8 Democrats and 2 Republicans. Every seat is up for election on November 3.
Counting continues; the result may still change. Fetched 2026-11-16 02:14 UTC. civicAPI
| District | Candidates and votes |
|---|---|
| District 1 | Suzan DelBene (Democratic, leading) · 198,290 votes 67.4% Mary Silva (Republican) · 94,796 votes 32.2% Write-in · 913 votes 0.3% |
| District 2 | Rick Larsen (Democratic, leading) · 230,569 votes 66.5% Edwin H. Feller (Republican) · 114,641 votes 33.1% Write-in · 1,341 votes 0.4% |
| District 3 | Marie Gluesenkamp Perez (Democratic, leading) · 189,802 votes 53.7% John Braun (Republican) · 160,595 votes 45.4% Write-in · 3,291 votes 0.9% |
| District 4 | Amanda McKinney (Republican, leading) · 130,634 votes 53.8% John Duresky (Democratic) · 111,621 votes 46.0% Write-in · 559 votes 0.2% |
| District 5 | Michael Baumgartner (Republican, leading) · 168,345 votes 52.0% Carmela Conroy (Democratic) · 154,092 votes 47.6% Write-in · 1,173 votes 0.4% |
| District 6 | Emily Randall (Democratic, leading) · 223,381 votes 62.4% Teresa Fox (Republican) · 133,747 votes 37.4% Write-in · 792 votes 0.2% |
| District 7 | Pramila Jayapal (Democratic, leading) · 323,922 votes 87.6% Nirav Sheth (Republican) · 44,603 votes 12.1% Write-in · 1,340 votes 0.4% |
| District 8 | Kim Schrier (Democratic, leading) · 193,720 votes 57.0% Spencer Meline (Republican) · 144,977 votes 42.7% Write-in · 924 votes 0.3% |
| District 9 | Adam Smith (Democratic, leading) · 189,965 votes 75.7% Doug Basler (Republican) · 59,320 votes 23.6% Write-in · 1,809 votes 0.7% |
| District 10 | Marilyn Strickland (Democratic, leading) · 174,446 votes 63.8% Chris D. Chung (Republican) · 97,054 votes 35.5% Write-in · 1,775 votes 0.6% |
Vote counts come from civicAPI, which gathers the counts published by state election offices; we transcribe them and do not tally.
Fox NewsNBC NewsThe Associated PressCNNBloomberg NewsNo official results for this state yet. Official state results page
Now held by Tony Evers
Counting continues; the result may still change. Fetched 2026-11-16 02:14 UTC. civicAPI
Vote counts come from civicAPI, which gathers the counts published by state election offices; we transcribe them and do not tally.
The latest three surveys as each pollster published them; we show them as released and do not calculate, weight or average them. Percentages are the share of respondents who say they would vote for each candidate. Surveys differ in timing, sample and method, so their numbers are not directly comparable.
| Pollster | Dates | Sample · population | Share who would vote for the candidate |
|---|---|---|---|
| Wickpartisan poll (REP) · for League of American Workers2026-10-19 – 2026-10-23 1,213 · likely voters | 2026-10-19 – 2026-10-23 | 1,213 · likely voters | David Crowley 48% Tom Tiffany 45% |
| Z to A Researchpartisan poll (DEM) · for Rust Belt Rising2026-09-28 – 2026-10-01 662 · likely voters | 2026-09-28 – 2026-10-01 | 662 · likely voters | David Crowley 49% Tom Tiffany 44% |
| Marquette University Law School2026-09-16 – 2026-09-23 692 · likely voters | 2026-09-16 – 2026-09-23 | 692 · likely voters | David Crowley 49% Tom Tiffany 46% |
The state has 8 seats in the US House; its current members are 6 Republicans and 2 Democrats. Every seat is up for election on November 3.
Counting continues; the result may still change. Fetched 2026-11-16 02:14 UTC. civicAPI
| District | Candidates and votes |
|---|---|
| District 1 | Mitchell Berman (Democratic, leading) · 158,839 votes 52.0% Bryan Steil (Republican) · 146,885 votes 48.0% |
| District 2 | Mark Pocan (Democratic, leading) · 317,125 votes 100.0% |
| District 3 | Rebecca Cooke (Democratic, leading) · 172,757 votes 52.4% Derrick Van Orden (Republican) · 150,873 votes 45.8% Alexander Valiensi Kent (Independent) · 4,035 votes 1.2% Rustin Provance (Independent) · 1,799 votes 0.5% Write-in · 0 votes 0.0% |
| District 4 | Gwen Moore (Democratic, leading) · 211,898 votes 80.0% Tim Rogers (Republican) · 46,301 votes 17.5% Arthur Burks (Independent) · 6,733 votes 2.5% |
| District 5 | Scott Fitzgerald (Republican, leading) · 220,992 votes 59.0% Andrew Beck (Democratic) · 153,277 votes 41.0% |
| District 6 | Glenn Grothman (Republican, leading) · 172,138 votes 52.8% Brad Smith (Democratic) · 141,346 votes 43.3% Elizabeth Anne Fitzgibbon (Nonpartisan) · 5,282 votes 1.6% Mike Thurow (Nonpartisan) · 3,879 votes 1.2% Matthew Arndt (Nonpartisan) · 3,491 votes 1.1% Write-in · 23 votes 0.0% |
| District 7 | Michael Alfonso (Republican, leading) · 193,911 votes 56.9% Fred Clark (Democratic) · 146,869 votes 43.1% Write-in · 24 votes 0.0% |
| District 8 | Tony Wied (Republican, leading) · 177,258 votes 53.9% Rick Crosson (Democratic) · 151,471 votes 46.1% |
Vote counts come from civicAPI, which gathers the counts published by state election offices; we transcribe them and do not tally.
No related reports for this state yet.
Now held by Shelley Moore Capito
Counting continues; the result may still change. Fetched 2026-11-16 02:14 UTC. civicAPI
Vote counts come from civicAPI, which gathers the counts published by state election offices; we transcribe them and do not tally.
Now held by Patrick Morrisey
No official results for this state yet.
The state has 2 seats in the US House; its current members are 2 Republicans. Every seat is up for election on November 3.
Counting continues; the result may still change. Fetched 2026-11-16 02:14 UTC. civicAPI
| District | Candidates and votes |
|---|---|
| District 1 | Carol Miller (Republican, leading) · 119,087 votes 57.1% Vince George (Democratic) · 82,705 votes 39.6% Belinda Fox-Spencer (Constitution) · 6,921 votes 3.3% |
| District 2 | Riley Moore (Republican, leading) · 144,109 votes 59.4% Ace Parsi (Democratic) · 98,615 votes 40.6% |
Vote counts come from civicAPI, which gathers the counts published by state election offices; we transcribe them and do not tally.
No related reports for this state yet.
Now held by Cynthia M. Lummis
Counting continues; the result may still change. Fetched 2026-11-16 02:14 UTC. civicAPI
Vote counts come from civicAPI, which gathers the counts published by state election offices; we transcribe them and do not tally.
Now held by Mark Gordon
Counting continues; the result may still change. Fetched 2026-11-16 02:14 UTC. civicAPI
Vote counts come from civicAPI, which gathers the counts published by state election offices; we transcribe them and do not tally.
The state has 1 seats in the US House; its current members are 1 Republican. Every seat is up for election on November 3.
Counting continues; the result may still change. Fetched 2026-11-16 02:14 UTC. civicAPI
| District | Candidates and votes |
|---|---|
| At-large | Chuck Gray (Republican, leading) · 99,906 votes 54.5% Lisa F. Kinney (Democratic) · 61,689 votes 33.7% Shawn Johnson (Libertarian) · 13,667 votes 7.5% Jeffrey Haggit (Constitution) · 7,961 votes 4.3% |
Vote counts come from civicAPI, which gathers the counts published by state election offices; we transcribe them and do not tally.
No related reports for this state yet.
Sources: us-atlas (ISC) · senate.gov · Wikipedia · congress-legislators (CC0) · English Wikipedia (CC BY-SA 4.0) · VoteHub (CC BY 4.0), fetched 2026-11-16 · state election offices · Wikidata (CC0) · civicAPI, fetched 2026-11-16
Portraits from Wikimedia Commons; authors and licences are on each person’s page.

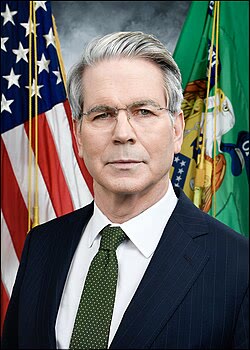
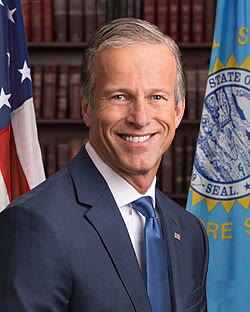
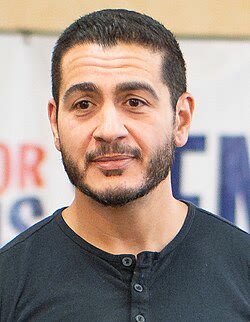
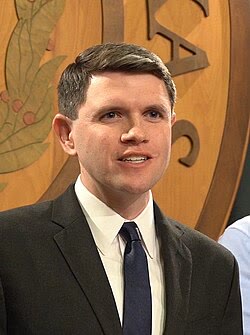
What the key figures said on the record, as reported.
Donald Trump210JD Vance26Abdul El-Sayed12Barack Obama9Ken Paxton8Hakeem Jeffries8Mike Johnson7Chuck Schumer7James Talarico7Marco Rubio2Pete Hegseth2Gavin Newsom2Scott Bessent1John Thune1As speculation swirls about his political future, Secretary of State Marco Rubio said there is more work to do and played down Republican losses in the midterm elections.
CCNN
Secretary of State Marco Rubio played down Republicans’ devastating midterm election losses on Friday, telling supporters that politics requires more than simply winning elections.
NNBC News
At his first news briefing since the midterms, Donald Trump discussed Nvidia CEO Jensen Huang’s affair with a woman alleged to be a Chinese spy, efforts to impeach Defense Secretary Pete Hegseth and major Republican losses at the ballot box last week.
NNBC News
Trump said his deportation policy might have been too tough for voters, but offered no details about what a deal would involve. Shortly after the Friday interview was taped, he named Stephen Miller, a key architect of his hard-line immigration agenda, as his new chief of staff.
TThe Associated Press
Trump questioned whether the midterm elections were honest, pointing to polls, early-vote dumps and voting machines. He also suggested there may be room for a compromise with Democrats on immigration policy.
TTRT World
Trump questioned the integrity of the midterm elections on Truth Social on Monday, making claims without evidence despite having previously accepted the results.
B BBC News
In an interview with CBS’s “60 Minutes,” Trump acknowledged that he felt his deportation agenda had gone too far and cost his party voter support in the midterm elections.
AABC News
In his first interview since Democrats’ midterm victories, Trump said he could make further Cabinet changes. A push to impeach Defense Secretary Pete Hegseth could begin as soon as today.
AABC News
Donald Trump acknowledged that some voters were unhappy with his administration’s controversial deportation drive and said it may have hurt Republicans in last week’s midterm elections. He said he could seek an immigration deal with the new Democratic-controlled Congress that would deport criminals but let “good people” stay. Chuck Schumer criticized Trump for placing Stephen Miller, an architect of the policy, in charge of the White House.
AAl Jazeera
In a television interview aired Sunday, Trump said his administration’s mass deportation campaign may have been “too tough.” His remarks came days after Republicans suffered heavy losses in the midterm elections.
FFrance 24
Related reports per day, by category.
2026-08-168 related reportsShow all dates
Bloomberg TelevisionBloomberg TelevisionBloomberg TelevisionBloomberg TelevisionReceipts Senate candidates reported to the Federal Election Commission, through 2026-10-22, highest first.
| Candidate | State | Receipts |
|---|---|---|
| James Talarico | Texas | $146,349,912 |
| Jon Ossoff incumbent | Georgia | $136,610,982 |
| Sherrod Brown | Ohio | $68,409,200 |
| Abdul El-Sayed | Michigan | $53,830,872 |
| Roy Cooper | North Carolina | $49,585,341 |
| Mary Peltola | Alaska | $36,887,509 |
| Cory Booker incumbent | New Jersey | $35,910,076 |
| S Krishnamoorthi | Illinois | $31,560,943 |
| Mark Warner incumbent | Virginia | $27,493,348 |
| Troy Jackson | Maine | $26,872,874 |
| Susan Collins incumbent | Maine | $25,225,468 |
| Josh Turek | Iowa | $24,290,521 |
| Annie Andrews | South Carolina | $24,216,841 |
| Chris Pappas | New Hampshire | $23,703,648 |
| Mike Rogers | Michigan | $23,016,439 |
| Ken Paxton | Texas | $22,327,474 |
| Darline Graham incumbent | South Carolina | $21,650,508 |
| Alexander Vindman | Florida | $20,487,916 |
| Jon Husted incumbent | Ohio | $19,894,786 |
| Adam Hamilton | Kansas | $19,175,044 |
| Bill Hagerty incumbent | Tennessee | $17,226,961 |
| Joshua Joseph Weil | Florida | $15,933,478 |
| Pete Ricketts incumbent | Nebraska | $14,546,959 |
| Ashley Moody incumbent | Florida | $14,524,032 |
| Tom Cotton incumbent | Arkansas | $14,517,576 |
| John Cornyn incumbent | Texas | $14,265,890 |
| Ashley Hinson | Iowa | $14,147,973 |
| Dan Sullivan incumbent | Alaska | $14,107,205 |
| Michael Whatley | North Carolina | $13,668,468 |
| Angie Craig | Minnesota | $13,380,880 |
| Haley Stevens | Michigan | $13,304,162 |
| William M. Cassidy incumbent | Louisiana | $13,298,957 |
| Andy Barr | Kentucky | $12,541,350 |
| John C. Fleming Jr. | Louisiana | $12,372,938 |
| John Hickenlooper incumbent | Colorado | $11,695,273 |
| Margaret Flanagan | Minnesota | $11,563,963 |
| Mallory McMorrow | Michigan | $11,405,912 |
| Angie Nixon | Florida | $11,319,380 |
| Jasmine Crockett | Texas | $11,096,966 |
| Dan Osborn | Nebraska | $11,029,845 |
Sources: openFEC (public domain), fetched 2026-11-16